Quantcast
Channel: Drilling Formulas and Drilling Calculations
Viewing all 497 articles
Browse latest View live

Very Interesting Technology – Versabar Claw Lift VB 10000 (Heavy Lift Catamaran)

$
0
0

We read about very interesting heavy lift catamaran named VB 10000. The VB 10,000 consists of two 240′ tall lift gantries joined to twin 300′ by 72′ barges to form a catamaran. The gantries are connected to the barges by patented articulated pins which decouple barge motion from the gantries. The vessel is equipped with a Class 3 DP system consisting of four 1,000 HP thrusters in each barge which enable it to maneuver on site and hold station in any water depth over 35 feet. The VB 10,000’s four 2,000-ton heavy lift blocks are paired with custom-engineered 400-ton hydraulic winches which may be operated independently or in a synchronized manner.

versabar vb10000 lift

You can watch videos below to see how it works.


VB 10,000 Jacket & Deck Installation

VB 10,000: Decommissioning

VB 10,000 Retrieves Gulf of Mexico Platform

Claw Retrieves Living Quarters

Ref: http://www.vbar.com/


The deepest depth on Norwegian shelf by Mærsk Gallant

$
0
0

Congratulate to Mærsk Drilling for making the record yesterday.

With a total depth of 5,941 metres(19,491 fr), Mærsk Gallant has beaten the record for deepest well ever drilled on the Norwegian continental shelf.

The crew of jack-up rig Mærsk Gallant has beaten the record for deepest well ever drilled on the Norwegian shelf.

The crew of jack-up rig Mærsk Gallant has beaten the record for deepest well ever drilled on the Norwegian shelf.

On 31 July, Mærsk Gallant drilled the Solaris ultra HPHT (high-pressure, high-temperature) well to a total depth of 5,941 metres TVD (True Vertical Depth).

This means that Mærsk Gallant has beaten the record for deepest well ever drilled on the Norwegian continental shelf.

Mærsk Gallant

“We have broken a number of records during the Solaris operation. But this achievement is second to none. There was a lot of cheering in the driller’s cabin that day,” says Sadi Ozturk, Assistant Rig Manager on Mærsk Gallant.

He continues:

“The Solaris exploration well is one of the most challenging wells in the North Sea. All crew members are very excited about this achievement.”

Demanding requirements

In the Solaris project – together with the customer, Total E&P Norge – Maersk Drilling has taken a 15,000 psi rig and adapted the equipment and procedures in order to drill a reservoir section where predicted pore pressures are well in excess of 15,000 psi.

The demanding requirements of the customer have led to a wide variety of modifications on the rig.

The record list

Given the extreme circumstances, the rig team on Mærsk Gallant has set several records during the operation.

The list includes:

1: the largest and most complicated BOP stack rig up.

2: the biggest cement job (600 m3 cement slurry).

3: the heaviest casing run (1,2M lbs).

4: first time a 20K BOP has been nippled up (installed) and used to drill an ultra HPHT well. 

At the moment, the crew members on Mærsk Gallant are in the process of plugging and abandoning the well and expect to commence the rig move in the beginning of September.

Ref: http://www.maerskdrilling.com/en/media-center/press-release-archive/2016/08/maersk_gallant

Failure Lifting – Mobile Crane Operations

$
0
0

Working on the rig both offshore and onshore always involves lifting operation using rig cranes or mobiles crane. Therefore, hazards associated with lifting operation must be carefully taken into account. We would like you to watch and learn from this video in order to understand risk of overloading the mobile crane and the final result. We wish this video would raise use some concerns regarding safe work practices while working with cranes.

Some safety tips about a mobile cranes are listed below;

10 Tips for Better Mobile Crane Operations by Randy Burbach

1. Never override the mobile crane’s computer.

2. Be aware of all overhead hazards – specifically close-by buildings and any power lines that are within the zone of operation.

3. Read the load charts – prior to turning the key in any new mobile crane.

4. Cell phones in the cab – while the crane’s key is on the cell phone is off.

5. Always note the changing conditions on the jobsite – from personnel to weather to surroundings.

6. Sometimes in a working situation, the crane operator needs to stop, evaluate, and find a safer lift plan.

7. Check ground conditions – before crane setup, ensure that the site is suitable to support your mobile crane and the future suspended loads.

8. Use appropriate pads & cribbing – mobile crane operators need to make sure they are using correct pads or cribbing to avoid having an outrigger fail or sink when they are making a lift.

9. Before starting your crane, always double check the oil, gas, and other fluid levels.

10. At the beginning of your shift, walk-around your crane checking for mechanical, electrical, structural, and hydraulic issues (MESH).

Lifting operations – cranes by http://www.hse.gov.uk/

What you need to do

The law says that all lifting operations involving lifting equipment must be properly planned by a competent person; appropriately supervised; and carried out in a safe manner.

Cranes and lifting accessories such as slings must be of adequate strength, tested and subject to the required examinations and inspections.

All crane operators, and people involved in slinging loads and directing lifting operations, must be trained and competent.

There are four key aspects to the safe use of cranes:

  • Planning lifting operations
  • Safe systems of work
  • Supervision of lifting
  • Thorough examination

What you need to know

Tower and mobile cranes are used extensively on construction projects and present two principal hazards:

Collapse of the crane – such incidents present significant potential for multiple fatal injuries, both on and off-site;
Falling of the load – these events also present a significant potential for death and major injury.
Other incidents have involved people being struck by moving loads, cranes contacting overhead conductors and cranes colliding with each other.

Planning lifting operations

All lifting operations should be planned so they are carried out safely with foreseeable risks taken into account.

The person appointed to plan the lifting operation should have adequate practical and theoretical knowledge and experience of the lifts being undertaken.

The plan will need to address the risks identified by a risk assessment, the resources required, procedures and the responsibilities so that any lifting operation is carried out safely.

The plan should ensure that the lifting equipment remains safe for the range of lifting operations for which the equipment might be used.

British Standard BS 7121Part 1 2006 sets out an acceptable standard for managing lifting operations using cranes on construction projects.

Safe systems of work

You must plan lifting operations carefully to ensure they are carried out safely. Your plan should result in a safe system of work which may need to be written down if it is a complex lift. This record is sometimes known as a method statement and you must ensure that everyone involved understands it.

Key elements include:

  • planning – including site preparation, crane erection and dismantling;
  • selection, provision and use of a suitable crane and work equipment
  • including safe slinging and signalling arrangements;
  • maintenance and examination of the crane and equipment;
  • provision of properly trained and competent personnel;
  • supervision of operations by personnel having the necessary authority;
  • thorough examinations, reports and other documents;
  • preventing unauthorised movement or use of the crane; and
  • measures to secure safety of persons not involved in the lifting.

Supervision of lifting

The right level of supervision must be in place for lifting operations, reflecting the degree of risk and personnel involved in the particular lifting operation.

The crane supervisor should direct and supervise the lifting operation to make sure it is carried out in accordance with the method statement.

The crane supervisor should be competent and suitably trained and should have sufficient experience to carry out all relevant duties and authority to stop the lifting operation if it is judged dangerous to proceed.

Thorough examination

There are strict legal requirements concerning the thorough examination of all cranes:

Lifting equipment must be thoroughly examined at the prescribed intervals.  This is a detailed and specialised examination by a competent person.

The examination will usually be arranged by the crane hire company, although it is the responsibility of the crane user to ensure that all necessary examinations are carried out and that the required reports are in order.

Records of thorough examinations and tests must be: readily available to enforcing authorities; secure; and capable of being reproduced in written form.

Ref: http://www.hse.gov.uk/construction/safetytopics/cranes.htm

http://www.iti.com/Crane-and-Rigging-Success/bid/58758/10-Tips-for-Better-Mobile-Crane-Operations

Baker Hughes To Cut Pay In Effort To Avoid More Job Cuts

$
0
0

Houston-based Baker Hughes Inc. plans to begin a temporary furlough program for some employees.

“In response to challenging industry conditions, Baker Hughes has implemented a temporary 5 percent pay reduction for certain U.S. employees during the last 14 weeks of 2016, while providing those employees four additional paid holidays,” according to a statement provided by a Baker Hughes spokeswoman. “These efforts will allow us to lessen the need for additional workforce reductions while remaining focused on serving customers and maintaining safe, compliant operations.”

The pay cuts will begin Sept. 11 and last through the end of the year. Certain employees in division such as global operations, chemical operations, human resources, sales, corporate security and information technology are exempt, the Houston Chronicle reports.

Several major energy companies — and oil field services companies in particular — have cut jobs during the oil downturn.

Baker Hughes, one of the largest oil field services companies in the world, reported 36,000 employees in July. That was down from 39,000 in its first-quarter release and 43,000 in its 2015 annual report.

Locally, Baker Hughes cut just over 1,000 jobs over the past year, according to HBJ research. Overall, job cuts averaged about 11 percent for the Houston-based energy companies that have reported employment data to the HBJ for the past two years.

However, Houston’s energy sector is at the tail end of the layoff process, Patrick Jankowski, vice president of research at the Greater Houston Partnership, told the HBJ recently.

“You get to a point where you just can’t cut anymore and still have a company,” Jankowski said. “There is a sense out there that the worst is over. Companies are trying to hold on to their employees for when things turn around.”

Baker Hughes is the third-largest oil field services company in the world, after Halliburton Co.  and Schlumberger Ltd., which cut 5,000 and 8,000 jobs in the second quarter, respectively.

– See more at: http://roughneckcity.com/roughneck-city/oilfieldnews/765/baker-hughes-to-cut-pay-in-effort-to-avoid-more-job-cuts#sthash.58K85veE.dpuf

Shape of the Earth and Geodetic Datums for Directional Drilling

$
0
0

Directional drilling relies on mapping system to accurately identify location of the wells. Therefore, it is very important to learn the basics of mapping and other relevant information. This topic is about Geodetic Datum.

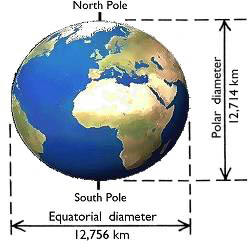
The Earth is not a complete sphere shape but it is actually Oblate Spheroid (“Spheroid”). It means that the shape of the Earth is almost a sphere. It can be proven from the fact that the equatorial diameter (the longest diameter) is approximately 12,756 km and the diameter from the North Pole to the South Pole is approximately 12,714 km (Figure 1). Additionally, the Earth has a different attitude based on location. So, people developed a model to help describe the Earth, which is called “Geodetic Datums”.

Figure 1 - Earth Shape

Figure 1 – Earth Shape

Geodetic datums are the reference systems describing the size and shape of the Earth and the origin and orientation of the coordinate systems used to map the Earth. Aristotle, a Greek philosopher and scientist, is the first person who estimated the size of the Earth and nowadays there are hundreds of different datums used around the world by different industries. Modern geodetic datums range from simple flat Earth modes to complex models.

Different countries and organizations use different geodetic datums for their work in order to indentify positions. Therefore, it is extremely important to reference the correct geodetic system in order to get the correct position. Using different systems can cause position errors. With current positioning technology, the accuracy of position can be less than meter accuracy. The following are Geodetic Datums used.

Flat Earth Models

Flat Earth Models are still used for plan survey where survey distance is short enough so that the Earth curvature is negligible (less than 10 km) (Figure 2).

Figure 2 - Flat Earth Model

Figure 2 – Flat Earth Model

Spherical Earth Models

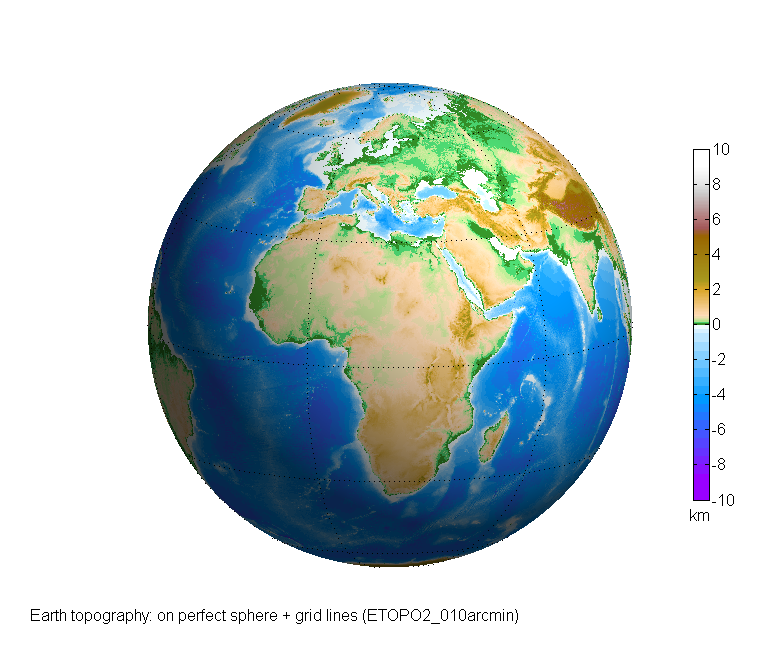
The Spherical Earth Models describe the Earth shape with a sphere with specific radius. They do not truly represent the shape of the Earth, however, these models are frequently used for short range navigation and for global distance estimation.

Figure 3 - Spherical Earth Models

Figure 3 – Spherical Earth Models

Ellipsiodal Earth Models

Ellipsiodal Earth Models are often used for accurate range calculation over a long distance. Each ellipsoidal Earth model defines a shape of the Earth with a polar radius and an equatorial radius. Loran-C and GPS navigation receivers use ellipsoidal Earth models to calculate position and waypoint information.

Figure 4 - Ellipsiodal Earth Models

Figure 4 – Ellipsiodal Earth Models

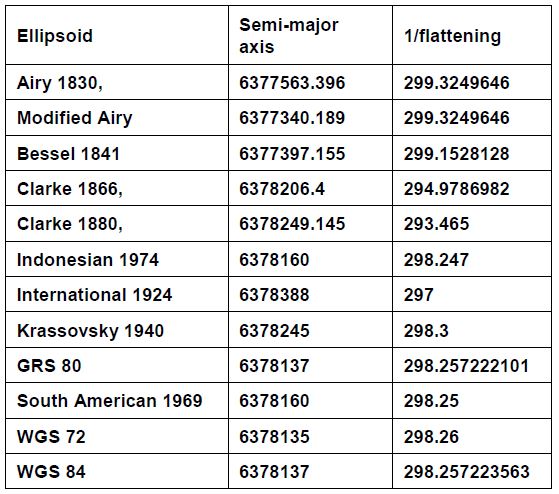
Reference ellipsoids are usually defined by semi-major (Equatorial radius) and flattening (the relationship between equatorial and polar radii). Other reference ellipsoid parameters such as polar radius (semi-minor axis) and eccentricity can be calculated from these terms. Table 1 shows several reference ellipsoids used in many different organizations.

Table 1 – Reference Ellipsoids

Table 1 - Reference Ellipsoids

References

Adam Bourgoyne, 2014. Directional Drilling and Deviation Control: Definitions and Reasons for Directional Drilling. 1st Edition.

French Oil & Gas Industry Association, 1990. Directional Drilling and Deviation Control. Edition. Technip Editions.

Tom Inglis, 1988. Directional Drilling (Petroleum Engineering and Development Studies) (v. 2). 1987 Edition. Springer.

Answering-christianity.com, (2013), Shape of Earth [ONLINE]. Available at: http://www.answering-christianity.com/earthshape_20030417112611.jpg [Accessed 3 September 2016].

Unknown, (2013), Flat Earth Model [ONLINE]. Available at: http://3.bp.blogspot.com/-kIEaxYPJwjU/VaeQWtbALOI/AAAAAAAAYgc/jb6NFvtDnKs/s1600/Flat%2BEarth%2BHypothesis.jpg[Accessed 1 September 2016].

www.asu.cas.cz, (2014), Spherical Earth Models [ONLINE]. Available at:http://www.asu.cas.cz/~bezdek/vyzkum/rotating_3d_globe/rotating_3d_globe/private/fig02/rotating_3d_globe_preview_Earth_topography_on_perfect_sphere_-_grid_lines_ETOPO2_010arcmin_GMT_globe_px0650.png [Accessed 1 September 2016].

op.gfz-potsdam.de, (2014), Ellipsiodal Earth Models [ONLINE]. Available at: http://op.gfz-potsdam.de/champ/media_CHAMP/psch_2_full.gif [Accessed 30 August 2016].

The University of Texas at Austin, 1656. Controlled Directional Drilling. Edition. Petroleum Extension Service.

Latitude, Longitude and Drilling Map Projection

$
0
0

Directional drilling maps are flat, but the Earth is an oblate spheroid. This leads to a challenge to accurately represent the wellbore position on the Earth on a piece of paper. In this section, you will learn about mapping techniques used in directional drilling, limitations and the errors of mapping techniques.

One of the most important concepts of mapping is latitude and longitude.

Latitude is a coordinate used to specify the north-south position of a location on the surface of the Earth. Latitude is an angle which starts from 0° at the equator to 90° at the Earth North-South poles. It is simply defined like this;

  • 0 ° at the equator
  • +90 ° at the North pole
  • -90 ° at the South pole

To define latitude, it is described in degrees, minutes and seconds. Parallel line of latitude is a small circle at particular latitude which is parallel with the Equator.

Figure 1 - Latitude and Longitude Diagram

Figure 1 – Latitude and Longitude Diagram

Longitude is a coordinate used to specify the east-west location on the surface of the Earth by describing as an angular measurement. Longitude is defined in degrees, minutes and seconds. Meridian lines are lines running from the North Pole to the South Pole which connect points with the same longitude. The prime meridian line, passing through the Royal Observatory, Greenwich, England, is defined at 0 degrees. From the prime meridian line to the East, it is identified as 0 to + 180 degrees. From the prime meridian line to the West, it is identified as 0 to – 180 degrees.

Latitude and longitude are used together in order to identify the location on the Earth. For example, the longitude and latitude of London written in degrees, minutes and seconds is 51°30′ 26″ N 0° 7′ 39″ W.

Figure 2 – Latitude and Longitude of London

Figure 2 – Latitude and Longitude of London

Earth Shape

The actual Earth’s shape is an oblate spheroid because the Earth’s equatorial diameter is slightly bigger than the Earth’s polar diameter. Even though the flatting of the Earth is one in three hundred, it makes a big difference in scale calculation in maps used in the directional drilling field. For map projections, different regions/countries use different reference ellipsoids and nowadays there are more than 50 ellipsoid models. Approximately, 15 ellipsoids can cover 98% of oil countries in the World. In order to accurately identify locations of the Earth, it is required to identify a Geodetic Datum which consists of ellipsoid, orientation of ellipsoid, unit of length, region of the Earth and office name.

Map Projection

Map projection is a method used to convert the position (latitude-longitude) on the surface of a sphere into another method of positioning that can be drawn on a flat map with known accuracy and a controlled degree of error. X-Y Cartesian coordinate is the most common map positioning method. Two commonly used methods for map projection are Lambert Conformal Conic Projection and Transverse Mercator (TM).

Lambert Conformal Conic Projection

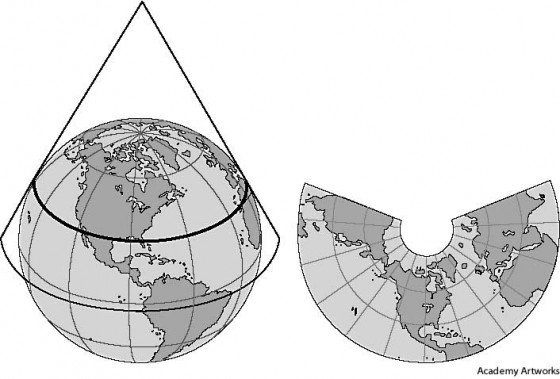
Lambert conformal conic projection (Figure 3), which was introduced by Johann Heinrich Lambert in 1772, is a projection method of the Earth onto a cone. The cone axis coincides with the geographic pole axis of the Earth.

Figure 3 - Lambert Projection

Figure 3 – Lambert Projection

Transverse Mercator

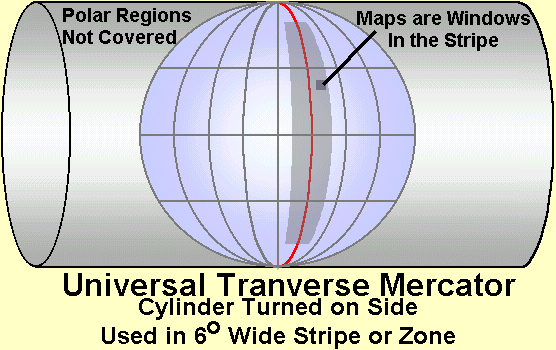
Transverse Mercator is most widely used for map projection and this is the basic principle of the Universal Transverse Mercator system. This method overcomes the scale error at high latitudes which will happen with the Mercator projection. The details in the map are projected into an imaginary cylinder for all latitudes with a narrow area of longitude.

Figure 4 - Transverse Mercator

Figure 4 – Transverse Mercator

References

Adam Bourgoyne, 2014. Directional Drilling and Deviation Control: Definitions and Reasons for Directional Drilling. 1st Edition.

French Oil & Gas Industry Association, 1990. Directional Drilling and Deviation Control. Edition. Technip Editions.

Tom Inglis, 1988. Directional Drilling (Petroleum Engineering and Development Studies) (v. 2). 1987 Edition. Springer.

BBC UK, (2014), Latitude and Longitude Diagram [ONLINE]. Available at:http://www.bbc.co.uk/staticarchive/e344e73982934a546e4c9909087547478672e9ad.png [Accessed 31 August 2016].

Bram.us, (2014), Lambert Projection [ONLINE]. Available at: https://www.bram.us/wordpress/wp-content/uploads/2012/03/conic-projection-560×379.jpg [Accessed 31 August 2016].

Wikipedia, (2014), Transverse Mercator [ONLINE]. Available at:https://upload.wikimedia.org/wikipedia/commons/thumb/8/8a/Transverse_mercator_graticules.svg/400px-Transverse_mercator_graticules.svg.png [Accessed 31 August 2016].

Animal You Caught While Working in the Oilfield

$
0
0

We have a post in Facebook Fanpage (https://www.facebook.com/drillingformulas) about animal that you cauguth while you were working in the field.  There are many people participating in this discussion so we would like to share some images sharing from our Facebook friends.

Riduan Ibrahim

Ernie Romero


David Calderon

Andrew Rose

Ray Rodriguez Lagunes

Hafizi Muhammad

Barry Ruxton

Awad Al Aqeed

Joakim Hopmark Gujord

Chinedu K. Anyiam

محمد ابوادريس


Rudy Martyono

Eli Robinson

Carlos Rodríguez

You can share your photos from this link – https://www.facebook.com/drillingformulas/photos/a.164002410305965.31806.136082489764624/1297232586982936/?type=3&theater

Shell has started production from the world’s deepest offshore oil and gas project, the Stones development in the Gulf of Mexico

$
0
0

Shell has started production from the Stones development in the Gulf of Mexico, the world’s deepest offshore oil and gas project.

When fully ramped up at the end of 2017, the development is expected to produce approximately 50,000 barrels of oil equivalent per day (boepd), the company informed in a statement.

“Stones is the latest example of our leadership, capability and knowledge, which are key to profitably developing our global deep water resources. Our growing expertise in using such technologies in innovative ways will help us unlock more deep water resources around the world,” Royal Dutch Shell Upstream Director, Andy Brown, said.

The project, fully owned and operated by the supermajor, is Shell’s second producing field from the lower tertiary geologic frontier in the Gulf of Mexico.

According to the company, it features a more cost-effective well design, requiring less material and lower installation costs, which is expected to offer a US$1 billion (£749.38 million) reduction in well costs.

The host facility for the Stones project is a floating production, storage and offloading (FPSO) vessel, the thirteenth in Shell’s global deep water portfolio, producing through subsea infrastructure beneath 9,500 feet.

The FPSO has been designed to operate safely during storms as it is able to disconnect and sail away from the field and return to safely resume production once the storm has passed.

Additionally, the Stones development uses an innovative lazy wave riser configuration, made up of a steel catenary riser with buoyancy added with an arch bend to decouple the vessel’s dynamic motions and subsequently increase riser performance.

As well as this, an ultra-deep water mooring system keeps the FPSO’s location over the Stones field.

The development of the field will start with two subsea production wells tied back to the FPSO, followed by six production wells.

Ref – http://www.offshorepost.com/video-worlds-deepest-oil-field-starts-production/


Universal Transverse Mercator Application in Directional Drilling

$
0
0

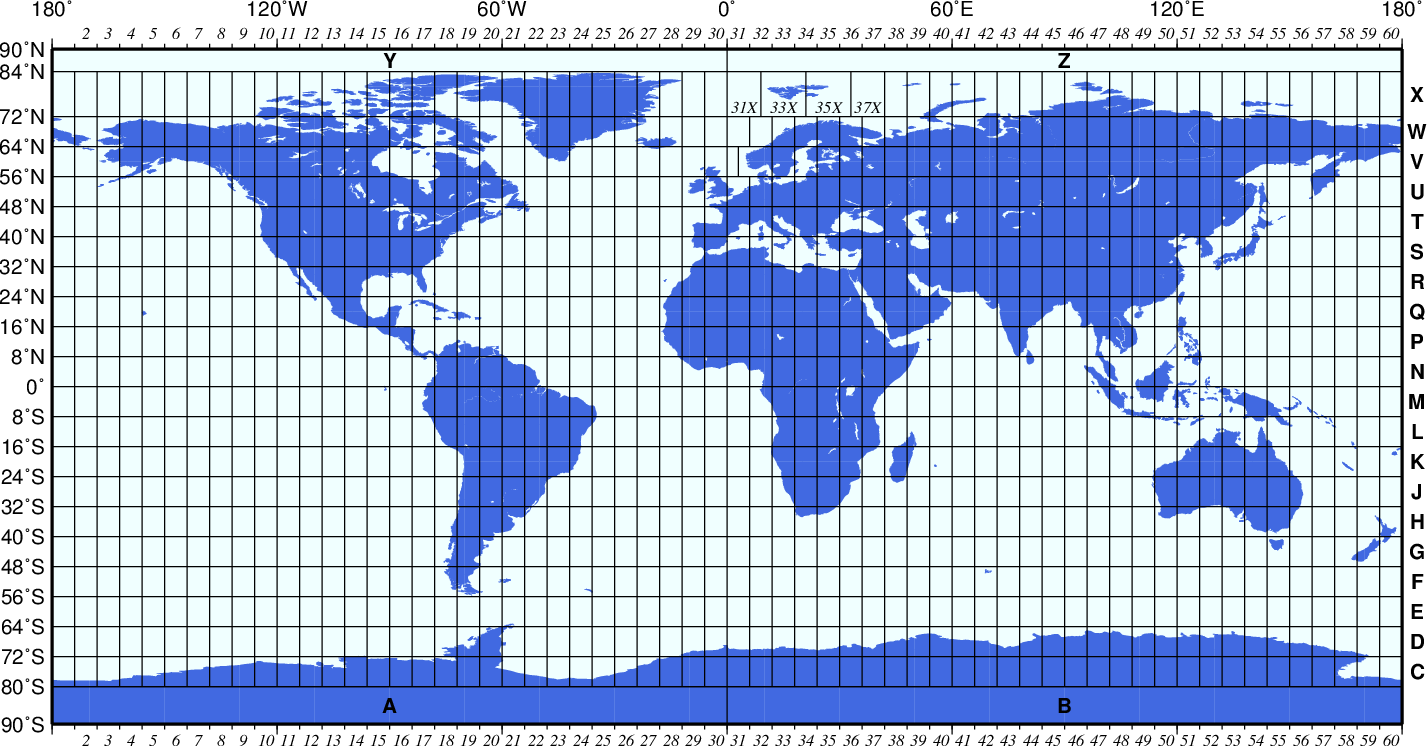
Universal Transverse Mercator (UTM) is one of the commonly used map projection methods in directional drilling. In UTM, the world is divided up into 60 zones between 84° North and 80° South and East-West from 180 degrees longitude. Then the Earth is flattened with the Zone 1 starting at 180 E-W longitude. Since the earth is divided into 60 zone so each zone has 6 degree wide. Figure 1 illustrates the concept of UTM and Figure 2 shows the UTM grid. This method will not cover the polar region.

Figure 1 - Universal Transverse Mercator Diagram

Figure 1 – Universal Transverse Mercator Diagram

Figure 2 - The Universal Transverse Mercator (UTM) grid

Figure 2 – The Universal Transverse Mercator (UTM) grid

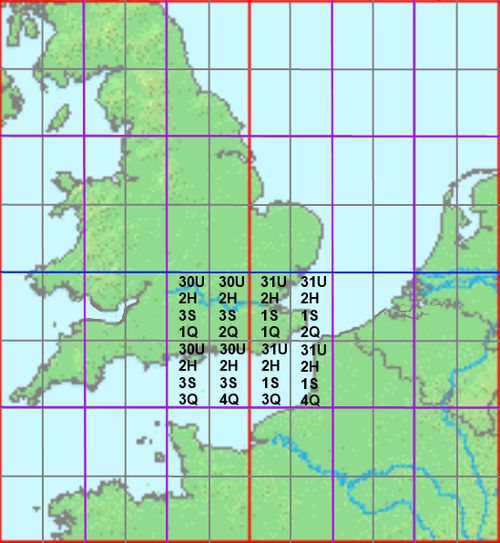
Zones are numbers from 1 to 60 and the zone 31 has 0 degree meridian (Greenwich, England) on the left and 6 degree East on the right (Figure 3). Each one in UTM is divided into grid sections which cover 8 degrees of latitude and the system uses letters from C to X, excluding I and O.

Figure 3 - UTM zone 31

Figure 3 – UTM zone 31

UTM Important Information

  • UTM divides the Earth into 60 zones and each zone has 3 degrees with its zone number as described earlier
  • Easting – It is the distance in meters from a central meridian line. The central meridian line is defined as 500,000 m. When the location is located to the East of the central meridian line, the final distance is equal to 500,000 m plus distance to the East. On the other hand, when the location is situated on the West of the central meridian line, the final distance equates to 500,000 m minus distance to the West. Easting range in value from approximately 200,000 m to 800,000 m.
  • Northing – It is the distance to the North or the South. Each zone in UTM system divides Northing into Northern Hemisphere and Southern Hemisphere.
  • Northern Hemisphere – 0 meters is defined at the equator and a value increases when moving towards the North.
  • Southern Hemisphere – 10,000,000 meters is defined at the equator and a value decreases when moving towards the South.

Figure 4 illustrates some of important points in each zone of UTM.

Figure 4 - Diagram of Each Zone of UTM

Figure 4 – Diagram of Each Zone of UTM

Example of UTM

The rig is located in UTM 30N. The location coordination is 400,000 E and 6,900,000 N.

The rig is located at 100,000 m West of the central meridian (500,000 – 100,000) and 6,900,000 m North of the equator. This can be illustrated into the UTM shown in Figure 5.

Figure 5 - Rig Location in UTM

Figure 5 – Rig Location in UTM

 Full Details about UTM can be seen from this video.

References

Adam Bourgoyne, 2014. Directional Drilling and Deviation Control: Definitions and Reasons for Directional Drilling. 1st Edition.

French Oil & Gas Industry Association, 1990. Directional Drilling and Deviation Control. Edition. Technip Editions.

Tom Inglis, 1988. Directional Drilling (Petroleum Engineering and Development Studies) (v. 2). 1987 Edition. Springer.

http://31.media.tumblr.com/a42476259b9f122f3f4325e671f56aaf/tumblr_inline_n47dx24KTA1rqjw0q.png
http://2.bp.blogspot.com/-b_rq_J2SmlU/VgAUxnhBsBI/AAAAAAAAAQU/lvsPpgHDhCI/s1600/GMT_utm_zones.png
http://www.oc.nps.edu/oc2902w/c_mtutor/images/utmdiagm.gif

Apache Revealed Massive Oil Shale Discovery in Texas

$
0
0

This is the big oil discovery in Texas, USA. Shale oil/gas technology made shale production profitable.

Have you ever worked on any shale oil/gas project?

Please feel free to share your experience in the comment below.

NEW YORK (CNNMoney)An overlooked corner of West Texas is believed to contain billions of barrels of newly-discovered shale oil.

Apache revealed the huge find this week after more than two years of stealthily buying up land, extensive geological research and rigorous testing.

The Houston company estimates the discovery, dubbed “Alpine High,” could be worth at least $8 billion.

Apache believes the new shale play spans at least five formations, contains over three billion barrels of oil and 75 trillion cubic feet of rich natural gas.

“We feel very confident with what we have and believe this is a story that’s only going to get better,” Apache CEO John Christmann IV told CNNMoney.

Apache Energy's huge shale oil discovery in West Texas, named

Apache Energy’s huge shale oil discovery in West Texas, named “Alpine High,” is estimated to contain three billion barrels of crude.(CNN Money)

Wall Street is already seeing dollar signs, sending Apache’s stock price surging 10% in the two trading days since the find was unveiled.

“The play has the potential to be a transformative event for the company,” Raymond James analyst John Freeman wrote in a research report. “Apache sees an incredible opportunity to establish the next big resource play in the U.S.”

Apache has identified at least 2,000 drilling locations, and estimates an initial value of between $4 million to $20 million per well. That translates to at least $8 billion in value for the company, but potentially a lot more. The company has already drilled 19 wells in the play, with nine currently producing “limited quantities” due to infrastructure constraints.

Rob Thummel, a portfolio manager at energy investment firm Tortoise Capital, said the announcement will “definitely open investors’ eyes” and could lead his firm to make an investment in Apache.

However, Thummel also urged caution, noting that Apache’s management team doesn’t have the long track record of more established shale companies like EOG Resources or Pioneer Energy.

“It’s going to be more of a prove-it story,” Thummel said.

Christmann, the Apache boss, said his company looks forward to “proving the significance of this discovery over time.” He added that the find is the result of “intense technical work,” including 3D seismic research.

So what’s next? Apache will need to continue testing the land to decide where it makes the most sense to start drilling at current prices. Both oil and natural gas prices remain depressed due to a huge glut, mostly fueled by excessive shale production from the U.S. over the past decade.

Apache will also need to build infrastructure to handle all the potential oil and gas coming out of Alpine High. The company is expected to install a temporary processing facility later this year and eventually build a more permanent presence.

“Rome wasn’t built in a day, neither are major oil and gas fields,” Thummel said.

Source – http://money.cnn.com/2016/09/08/investing/apache-huge-oil-discovery/index.html

Scale Factor in UTM Mapping System and its Application in Directional Drilling

$
0
0

Scale factor represents distortion from a mapping system since the Earth is mapped into a flat surface, but the actual surface is in curvature. Figure 1 illustrates a scale factor with a reference location of the Earth’s surface. If the location is above the map projection plan, the scale factor will be less than 1.0. However, if the location is below the mapping projection, the scale factor will be more than 1.0. A scale factor less than 1 means that the actual distance on the Earth’s surface is longer than the actual distance on the map. Whereas, the scale factor of more than 1 demonstrates that the actual distance on the Earth is shorter than the map distance.

Figure 1 - Scale Factor

Figure 1 – Scale Factor

For UTM, the central meridian (CM) has a scale factor of 0.9996. The locations where the scale factor is one are 320,000m E and 680,000 E (Figure 2).

Figure 2 - Scale Factor Depending on Location for each UTM zone

Figure 2 – Scale Factor Depending on Location for each UTM zone

Example:

This example demonstrates how to use the scale factor to calculate the distance projected in the map.

The surface location is located in UTM 30N. The location coordination is 400,000 E and 6,900,000 N. and the target is located at 401,000 E and 6,899,500N and the UTM zone is 30N. The scale factor at the location is 0.999685. The surface and the target for this  can be illustrated in Figure 3.

Figure 3- Surface and Target Location

Figure 3- Surface and Target Location

Distance from Surface Location to Target

ΔN = 6,899,500 – 6,900,000 = – 500 m

ΔE = 401,000 – 400,000 = 1,000 m

map-distance

Map Distance = 1118.034 m

Figure 4 - Distance from surface to the target illustration

Figure 4 – Distance from surface to the target illustration

True Distance

This distance must be applied to the scale factor in order to get the true distance.

True Distance (m) = Map Distance ÷ scale factor

True Distance (m) = 1118.034 ÷ 0.999685 = 1118.3863 m

The true distance is the horizontal displacement referencing from the surface location to the target.

Target Azimuth

The target in reference to the surface location is located in 2nd quadrant; therefore the target azimuth is calculated by the following relationship;

Target AZI = 90 + tan-1(ΔN÷ΔE)

Target AZI = 90 + tan-1((500) ÷ (1000))

Target AZI = 116.565 degree

References

Adam Bourgoyne, 2014. Directional Drilling and Deviation Control: Definitions and Reasons for Directional Drilling. 1st Edition.

French Oil & Gas Industry Association, 1990. Directional Drilling and Deviation Control. Edition. Technip Editions.

Tom Inglis, 1988. Directional Drilling (Petroleum Engineering and Development Studies) (v. 2). 1987 Edition. Springer.
Baker Hughes cuts employee pay 5 percent by using furloughs

$
0
0

This might be good ideas from Baker Hughes to keep oil and gas people in the business during downturn. Read the full details below.

Houston-based Baker Hughes is cutting employee pay for many U.S. workers by 5 percent through a new furlough program to reduce costs and lessen the need for additional job reductions.

The pay cuts, which Baker Hughes described as temporary, will stretch from the pay period beginning Sept. 11 through the final paycheck of the year. In exchange for the pay cut, employees will get holidays on Oct. 10, Nov. 23, Dec. 23 and Dec. 28, according to an internal memo acquired by the Houston Chronicle.

The memo said the furlough program is designed to “help Baker Hughes reduce the need for additional layoffs and to achieve the cost savings needed to enable profitable growth.” Among those excluded from the pay cuts are some top executives and other global operations employees in the United States;  many employees in chemicals operations; some human resources workers; many sales people; and corporate security and information technology workers, among others. Most leadership is included in the furlough, according to the memo.

Baker Hughes spokeswoman Melanie Kania said in a prepared statement, “These efforts will allow us to lessen the need for additional workforce reductions while remaining focused on serving customers and maintaining safe, compliant operations.”

Baker Hughes, the world’s third largest energy services company, cut about 3,000 jobs in the second quarter, bringing the total jobs eliminated over the past 18 months to 26,000, including 23,000 through layoffs and and 3,000 via attrition. Baker Hughes previously eliminated 2,000 jobs in the first quarter and 18,000 last year. Baker Hughes employs about 36,000 people globally now, down from more than 62,000 employees before the oil bust began in late 2014. The last local headcount provided by Baker Hughes was about 5,700, but that was before the second-quarter cutbacks.

Baker Hughes, posted a second-quarter loss of more than $900 million despite receiving a $3.5 billion breakup fee check from Halliburton after the companies were unable to complete a merger in the face of opposition for U.S. antitrust officials. The companies merger agreement was allowed to expire at the end of April.

Like other energy services companies, Baker Hughes has been battered by the oil downturn. But unlike his counterparts, Baker Hughes CEO Martin Craighead sounded more pessimistic about the direction of the industry during a call with analysts at the end of July.

“I don’t subscribe to the hopeful commentary that gets thrown around a lot,” Craighead said at the time. “We don’t expect to see a meaningful recovery in the second half of the year.”

In the wake of the failed merger, Baker Hughes, is refocusing on technology and equipment sales, with the idea of putting fewer boots on the ground in the oil patch.

Back in May, the company said it planned to reduce its annual costs by $500 million by the end of the year. More recently, executives confirmed the third quarter of the year would see a strong focus on additional costs cutting.

Ref: http://fuelfix.com/blog/2016/09/01/baker-hughes-cuts-employee-pay-5-percent-through-furloughs/
http://marcellusdrilling.com/2016/09/baker-hughes-avoids-another-round-of-layoffs-by-using-furloughs/

Magnetic Declination and Grid Convergent and Their Applications in Directional Drilling

$
0
0

This article will describe about Magnetic Declination and Grid Convergent and how to use them for directional drilling purposes.

Magnetic Declination

In the azimuth reference, three North references are Magnetic North, True North and Grid North (Figure 1). Since these 3 North references are not the same direction; therefore, it must be a correction in order to convert any Azimuth in the same reference. Two main concepts, which are magnetic declination and grid convergent, are used to AZI from the magnetic tool to the AZI referencing to the Grid North.

Figure 1 - True North, Magnetic North and Grid North

Figure 1 – True North, Magnetic North and Grid North

Magnetic Declination

Magnetic declination is the angle on the horizontal plane between Magnetic North and True North. The angle of Magnetic Declination can be clockwise or counterclockwise from True North to Magnetic North and this will represent either positive or negative declination value as shown in the relationship below.

Angle clockwise from True North to Magnetic North = Positive Declination (East Declination)

Angle counterclockwise from True North to Magnetic North = Negative Declination (West Declination)

Figure 2 simply demonstrates East and West Declination

Figure 2 - Magnetic Declination Simple Illustration

Figure 2 – Magnetic Declination Simple Illustration

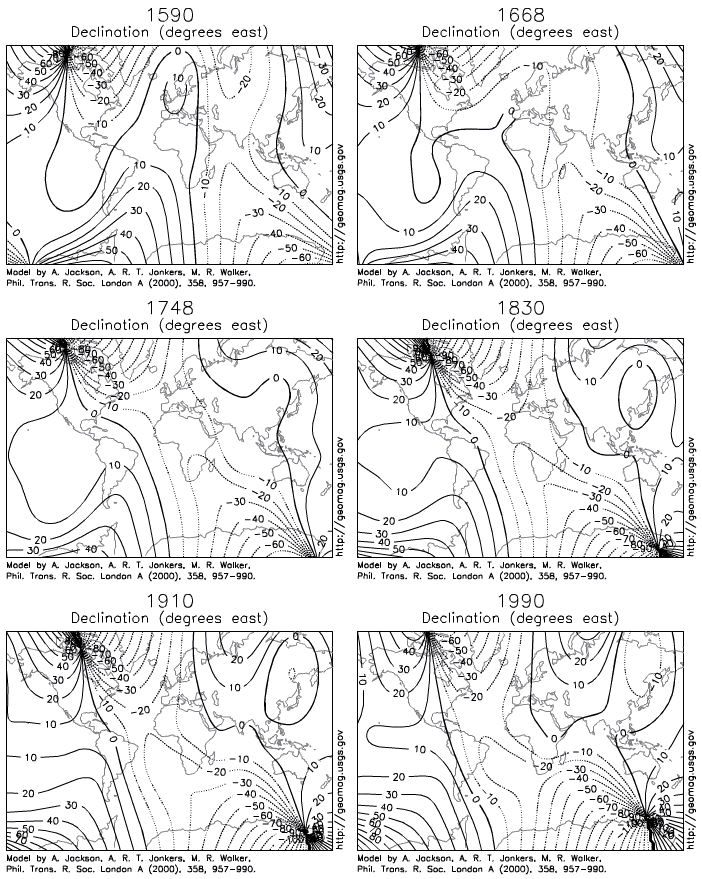
Magnetic Declination varies by the location and time. Declination values can be obtained from either isogonic charts (Figure 3), referred to as “magnetic variation charts,” which are produced by various geophysical and hydrographic institutions around the world, or from computer models, such as those available from the international geomagnetic reference field (IGRF) or the British Geological Survey (BGS). Figure 4 shows the declination changes over time.

Figure 3 - Isogonic charts (https://en.wikipedia.org/wiki/File:World_Magnetic_Declination_2015.pdf)

Figure 3 – Isogonic charts (https://en.wikipedia.org/wiki/File:World_Magnetic_Declination_2015.pdf)

Figure 4 - Magnetic Declination Varies with Time

Figure 4 – Magnetic Declination Varies with Time

Applying Declination

This is a formula to apply the declination.

True Azimuth = Magnetic Azimuth + Declination

Example 1  (Figure 5)

Declination = 15 degree (East Declination)

Magnetic Azimuth = 90 degree

True Azimuth = Magnetic Azimuth + Declination

True Azimuth = 90 + 15 = 105 degree

Figure 5 - Example 1

Figure 5 – Example 1

Example 2 (Figure 6)

Declination = -15 degree (West Declination)

Magnetic Azimuth = 90 degrees

True Azimuth = Magnetic Azimuth + Declination

True Azimuth = 90 + (-15) = 75 degrees

Figure 6 - Example 2

Figure 6 – Example 2

Grid Convergence

Grid convergence is an angle between True North and Grid North. The angle can be clockwise or counter clockwise from True North to Grid North.  Positive or negative convergence is described by the relationship below;

Angle clockwise from True North to Grid North = Positive Convergence (East Convergence)

Angle counter clockwise from True North to Grid North = Negative Convergent (West Convergence)

Figure 7  illustrates the grid convergence based on the position of the location in the UTM map.

figure-7-grid-convergence-based-on-location-in-the-utm-map

Figure 7 – Grid Convergence Based on Location in the UTM Map

Applying Grid Convergence

 This is the formula to apply the grid convergence.

Grid Azimuth = True Azimuth – Grid Convergence

 Example 3 (Figure 8)

True Azimuth = 80 degrees

Grid convergence = 2 degrees (East Convergence)

Grid Azimuth = True Azimuth – Grid Convergence

Grid Azimuth = 80 – 2 = 78 degrees

Figure 8 - Example 3

Figure 8 – Example 3

Example 4 (Figure 9)

True Azimuth = 80 degrees

Grid convergence = -2 degrees (West Convergence)

Grid Azimuth = True Azimuth – Grid Convergence

Grid Azimuth = 80 – (-2) = 82 degrees

Figure 9 - Example 4

Figure 9 – Example 4

Applying Declination and Grid Convergence

Grid Azimuth = Magnetic Azimuth + Declination – Convergence

Example 5 (Figure 10)

Declination = 20 degrees (East)

Convergence = -2 degrees (West)

Magnetic AZI = 90

Grid Azimuth = 90 + 20 +2 = 112 degrees

Figure 10 - Example 5

Figure 10 – Example 5

Summary

True Azimuth = Magnetic Azimuth + Declination

Grid Azimuth = True Azimuth – Convergence

Grid Azimuth = Magnetic Azimuth + Declination – Convergence

References

Adam Bourgoyne, 2014. Directional Drilling and Deviation Control: Definitions and Reasons for Directional Drilling. 1st Edition.

French Oil & Gas Industry Association, 1990. Directional Drilling and Deviation Control. Edition. Technip Editions.

Tom Inglis, 1988. Directional Drilling (Petroleum Engineering and Development Studies) (v. 2). 1987 Edition. Springer.


Well in an Unbalanced Condition (Video)

$
0
0

The well is in an underbalanced condition while pulling out of hole. You can see in the video below that the fluid is flowing up from the drill pipe side. It is such very important to understand the condition of the well and have the plan to deal with it.


These are some thought about this situation from our member in the Facebook fanpage.

Hossam Hamza – Looks like it was failed balanced cement plug job, I see long cement chiksan line on rig floor and circulating head connected with low TQ valve above 1 joint DP in mouse hole, the back flow due to over displacement. Is my guess right????

Rizwan Butt – Besides helmet, Safety gogals, Gloves are missing also so many trip fall hazards. as operation is concern this usually happen when you pullout of hole with circulation, it is suggested to place NRV in BHA, in case failure NRV install safety valve and connect it with TDS, and yes in such situations shut-in well should be initiate to avoid kick because of decrease in hydro static pressure.

Kejin Walls – This is one of the most unsafe Acts at a Rig. Improper PPE @ all times isn’t any safer for the employees. Incase of Failure by the VR plug in the Casing & NRV to loop the BHTA, thats what happens.

Dana Parks – Some of these comments are funny the proper procedure would be to install stabbing valve close it then, ibop and then the Kelly or top drive, shut in the well and monitor for pressures if there are no pressure or slight pressure without a rise then circulate and balance out the well while monitoring for a pit gain most likely as it looks like a fucked up cement job there would be zero on the casing side and slight pressure on the drill pipe side the cement is falling in the annulus and pushing the mud up the drill pipe but there has been kicks while cementing also if the idiots mixed wrong and dropped the hydrostatic so better to shut in and figure it out then make the right decisions

Chris W Vardon – What is wrong with you, seriously? No wonder Canadian supervisors are so wanted over there. For a split second, I figured you would have a stabbing valve in there before the elevators were installed, and then start well control procedures. EXACTLY why I will never work on a metal killing machine again. Way to put your whole crew’s lives at risk. RUN the whole rig off…

Andy Thomson This only happens in two situations 1 the mud weight in the annulus is heavier than the drill string causing back flow as the well tries to get in balance. OR the well is flowing. TIW vv should be installed and annular closed and pressures monitored. Not latch elevators and POOH

What is you idea about this situation?

Please feel free to share in the comment below

AutoTrak Rotary Steerable System from Baker

$
0
0

AutoTrak Rotary Steerable System from Baker Hughes is one of the most popular RSS tool.  We have several feedback from people in our Facebook page and this is what they say.


Gaspar Giroto We used here in unconventional project of Argentina, and what can i sey … It’s a really good tool, you have a long value ranges for create DLS and you can make them modifying active force and/or Bending Moment, that is good for have presicion in your well trayectory. But nevertheless we have a bad experience here, it failed all the time (Not only RRS, but also Ontrak and Copilot)… Any way, we did record in one last section in spite of have 5 run. It’s amazing

Eko Prasetyo We used in 3 horizontal wells to drain the limestone reservoir with the water contact window only 5ft below with no significant problem during the job.. created smooth trajectory.. two thumbs up

Eirik Kittelsen Its a very accurate tool as long as the formation is no to lose. Which makes the non rotating sleeve spin. Easy to use and mostly very reliable. The wells is like a gun barrel. Easy to run casing as there are limited amounts of ledges and high doglegs.

Shraddhanand More Two ways communication feature & constant RPM directional sleeve make BAKER’s RSS technology Unique.

David Haddad Already used it for geosteering in 80cm layers of sand ! Amazing tool !
Ten Time better than the powerdrive because i used both

Atanu Bhattacharya Accuracy..smoothness…fast..undoubtedly best performed tool!

Please feel free to share your experience about it in the comment box below.


Texas Earthquakes Caused By Fracking, Say Scientists !!!

$
0
0

We’ve never done fracking jobs so we don’t know if this is true. It is quite difficult to understand the relationship about Earthquake and Fracking. Please let us about your comment down at the comment box below.

Story –> Scientists say that five Texas earthquakes, including one that hit a magnitude of 4.8 on the Richter scale, were all directly caused by fracking. The scientists used a space-based radar that revealed the quakes were triggered by injections of wastewater in both oil and gas drilling.

Five “significant” earthquakes in 2012 and 2013 shook up the Timpson area in East Texas. For the very first time, a group of scientists could track the ground’s movements through radar from satellites. On Thursday, a report in the professional journal Science confirmed that the quakes had occurred unnaturally. Previously, scientists had found this to be likely through a more traditional method.

frack

Co-author of the report in Science, William Ellsworth of Stanford University, said that the method offers a brand new technique to determine whether certain earthquakes are caused by man or if they occur naturally.

The group observed two groups of wells, eastern and western. According to Ellsworth, the eastern wells were shallow and the satellite revealed that they weren’t the cause. Instead, the western, deeper wells with a higher volume were proven to be the culprit.

Seismologist at Cornell University, Rowena Lohman was not a part of the scientific study. However, she commented that the study demonstrates the importance of satellite data. Satellite data of ground changes offers great ways to complement what is being measured on the ground.

Though the quakes have stopped, Ellsworth remarked, “The area was shaken pretty thoroughly over a period of about 18 months.”

Ellsworth added that as the injection of wastewater radically declined, so did the shaking. Other areas such as Kansas and Oklahoma have learned this same lesson for themselves.

“Part of the solution is how we manage this problem,” Ellsworth continued, “If we get the pressure to go down at depth, the earthquakes stop. “

Manoochehr Sirzaei, Arizona State University geophysicist, also participated in the study. “We’re going to have wastewater injection. It’s going to happen,” says Sirzaei, “The solution is to customize the injection. You can come up with an injection strategy.”

More than 2,300 earthquakes above a magnitude 3 score on the Richter scale occurred in central and eastern states between 2009 and 2016. This is nearly three times as many quakes that have happened in these states over the last 39 years.

Many earthquakes that are caused by wastewater injection usually aren’t severe enough to cause any major damage, though a few still do. The Timpson quake shattered windows and damaged a chimney said one local news station.

The Texas Railroad Commission is responsible for the regulation of oil drilling in the state. According to the Texas Tribune, the Commission has never openly acknowledged that fracking caused the earthquakes in Texas. However, the Commission’s behavior leads many to believe that the agency is somewhat cognizant of the association.

Recently, the Environmental Protection Agency commended the Texas Railroad Commission for establishing firmer guidelines to lessen any shaking brought on by wastewater injection while indicating that the EPA “believes there is a significant possibility that North Texas earthquake activity is associated with disposal wells,” which contradicts the Commission’s previous claims.

Ref: http://houstonenergyinsider.com/?p=6266

OPEC agrees to limit oil output at 32.5 million barrels per day = Oil jumps 6%

$
0
0

ALGIERS (Reuters) – OPEC agreed on Wednesday to cut its oil output for the first time since 2008, with the group’s leader Saudi Arabia softening its stance on arch-rival Iran amid mounting pressure from low oil prices.

Two sources in the Organization of the Petroleum Exporting Countries said the group would reduce output to 32.5 million barrels per day from current production of 33.24 million bpd.

How much each country will produce is to be decided at the next formal meeting of OPEC in November, when an invitation to join cuts could also be extended to non-OPEC countries such as Russia, sources said.

OPEC logo is pictured ahead of an informal meeting between members of the Organization of the Petroleum Exporting Countries (OPEC) in Algiers, Algeria September 28, 2016. (REUTERS Photo)

OPEC logo is pictured ahead of an informal meeting between members of the Organization of the Petroleum Exporting Countries (OPEC) in Algiers, Algeria September 28, 2016. (REUTERS Photo)

Oil prices LCOc1 jumped more than 5 percent to trade above $48 per barrel as of 1830 GMT after the outcome of OPEC’s informal meeting in Algeria took traders by surprise. Still, many said they wanted to see the details of the deal.

“We don’t know yet who’s going to produce what. I want to hear from the mouth of the Iranian oil minister that he’s not going to go back to pre-sanction levels. For the Saudis, it just goes against the conventional wisdom of what they’ve been saying,” said Jeff Quigley, director of energy markets at Houston-based Stratas Advisors.

Saudi Energy Minister Khalid al-Falih said on Tuesday that Iran, Nigeria and Libya would be allowed to produce “at maximum levels that make sense” as part of any output limits which could be set as early as the next OPEC meeting in November.

That represents a strategy shift for Riyadh, which has said it would reduce output to ease a global glut only if every other OPEC and non-OPEC producer followed suit. Iran has argued it should be exempt from such limits as its production recovers after the lifting of EU sanctions earlier this year.

The Saudi and Iranian economies depend heavily on oil but in a post-sanctions environment, Iran is suffering less pressure from the halving in crude prices since 2014 and its economy could expand by almost 4 percent this year, according to the International Monetary Fund.

Riyadh, on the other hand, faces a second year of budget deficits after a record gap of $98 billion last year, a stagnating economy and is being forced to cut the salaries of government employees.

(Additional reporting by Vladimir Soldatkin, Patrick Markey and Lamine Chikhi in Algiers, Andrew Torchia in Dubai; Writing by Dmitry Zhdannikov; Editing by Dale Hudson)

PHOTO: Algerian Energy Minister Noureddine Bouterfa speaks during a news conference after the end session of the 15th International Energy Forum Ministerial (IEF15) in Algiers, Algeria September 28, 2016. REUTERS/Ramzi Boudina

Determine Thickness of Concrete for Concrete Coated Pipeline

$
0
0

Coating the subsea pipeline with concrete is a technique to add downward force for stability of pipelines situated on the seabed. Figure 1 shows that the concrete coated subsea pipe line is being welded. This article will demonstrate how to calculate the thickness of concrete required in order to achieve the required net down force.

Figure 1 - The Concrete Coated Subsea Pipe Line is being Welded

Figure 1 – The Concrete Coated Subsea Pipe Line is being Welded

Determine thickness of coated cement based on the given information below.

Given Information

Pipeline size OD = 24” Inch

Weight of steel pipe/ft = 145 lb/ft

Fresh water density = 64.2 lb/cu-ft

Sea water density = 65.52 lb/cu-ft

Concrete SG = 2.8

Required net down force for pipeline stability = 200 lb/ft

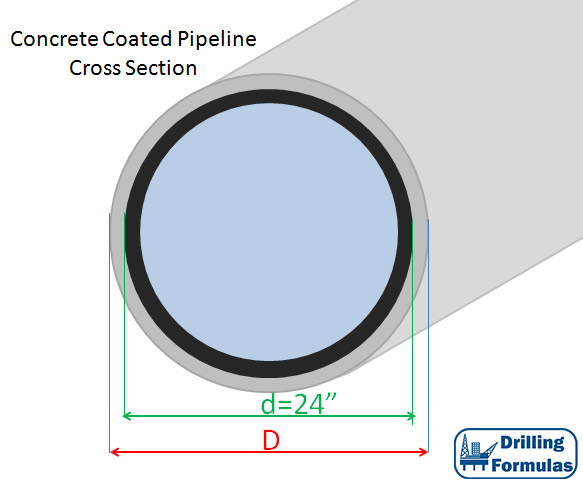
Figure 2 - Cross Section of Concrete Coated Pipeline

Figure 2 – Cross Section of Concrete Coated Pipeline

Force Diagram

Upwards force is buoyancy from the sea water.

Downwards force is weight of cement and pipeline.

Figure 3 shows the diagram of force acting on the pipe.

Figure 3 - Force acting on the pipeline

Figure 3 – Force acting on the pipeline

Based on the requirement, the relationship can be written in the mathematical equation shown below;


200 = Weight of pipe + Weight of Concrete – Buoyancy Force

Weight of pipe = 145 lb/ft

Weight of Concrete = Volume of concrete per ft × Density of concrete

Weight of Concrete = Volume of concrete per ft × SG of concrete × Water Density

weight-of-concrete

Buoyancy Force = Volume of coated pipeline per ft × Density of sea water

buoyancy-force

Solve for D;

D = 31.8 inch

Total diameter is 31.8 inch.

Thickness of cement required = (31.8-24) ÷ 2 = 3.9 inch

The method to coat the pipe line is shown as per the video below.

Oil Well Cement Additives

$
0
0

Most oil well cement slurries will be added to some additives in order to modify cement properties so cement operation can be properly performed. In this article, it will cover some of important cement additives in general terms so that it will help you understand the basic function of each additive.

oilwell-cement-addtives

Accelerators

Accelerators are added to shorten the time for cement to properly set and it will reduce rig time while waiting on the cement (WOC). Accelerators are crucial in shallow depths where bottom temperature is low. In the deeper section, it may not require an accelerator, because the well is hot enough and the thickening time will be normal. The WOC time is generally based on the time required to obtain 500 psi compressive strength of the cement.

Chemical used as accelerators are as follows;

  • Calcium chloride 1.5 – 2.0 %
  • Sodium chloride 2.0 – 2.5%
  • Sea water

If the percentage of these additives is high, they will act as retarders instead of accelerators.

Retarders

Retarders have the opposite function as accelerators because they are used to prolong thickening time of cement in order to prevent premature setting of cement. Retarders are used in the deeper hole section where bottom hole pressure is high.

Chemical used as retarders are as follows;

  • Calcium lignospulphanate
  • Saturated salt solution

Light Weight Additives (extenders)

Lightweight additives are used to reduce slurry density. Some sections in the well may require a reduced cement weight because a formation fracture gradient is quite low. With normal cement density, it can cause cement losses and it will result in a bad cement job. Reducing the cement density will cause decreasing in compressive strength and increasing in thickening time.

Chemicals used as light weight additives are as follows;

  • Bentonite (2%-16%)
  • Pozzolan
  • Diatomaceous earth (10%-40%)

Heavy Weight Additives

Heavy weight additives are added in order to increase slurry density. Some overpressures zones must be cemented with a high density cement.

Chemicals used as heavy weight additives are as follows;

  • Barite
  • Hematite
  • Sand

Fluid Loss Additives

Fluid loss additives are added to prevent dehydration of cement; therefore, the cement will maintain proper water portion and the cement properties will not be destroyed. Squeeze cementing requires a low fluid loss because cement must be squeezed into intended zones before the filter cake builds up. Fluid loss for a primary cement job maybe as critical as a squeeze cement job.

Chemicals used as fluid loss additives are as follows;

  • Organic polymers 0.5 – 1.5%
  • Carboxymethyl hydroxyethyl cellulose 0.3% – 1.0%

Friction Reducing Additives

Friction reducing additives are used to improve the cement slurry flow properties. The additives will reduce the viscosity so that turbulence flow will happen with a low pumping pressure. With the help from friction reducing additive, the risk of fracturing formation from excessive pressure can be minimized.

Chemicals used as friction reducing additives are as follows;

  • Polymers 0.3 – 0.5lb/sx
  • Salt 1-6 lb./sx
  • Calcium lignosulphanate 0.5 -1.5 lb./sx


25 World’s Largest Public Oil & Gas Companies in 2016 – Interesting Information

$
0
0

The World’s Largest Public Oil & Gas Companies in 2016 by Forbes. This is so interesting to know that Russian companies are ranked as the first and the second biggest public oil and gas company in 2016.

Forbes’ List of the 25 Biggest Public Oil & Gas Companies

  1. Gazprom gazprom(GAZP, com) – Russia – 8.38 MMBoepd – EV $84.3 billion
  2. Rosneftrosneft (ROSN, com) – Russia – 5.07 MMBoepd – EV $72.5 billion
  3. ExxonMobil exxon( XOM, com) – USA – 4.10 MMBoepd – EV $390 billion
  4. PetroChina petrochina( PTR, com) – China – 4.07 MMBoepd – EV $303 billion
  5. BP bp(BP; com) – UK – 3.24 MMBoepd – EV $121 billion
  6. Royal Dutch Shell shell(RDS.A – com) – Netherlands – 2.95 MMBoepd – EV $216 billion
  7. Chevron chevron(CVX; com) – USA – 2.62 MMBoepd – EV $207 billion
  8. Petrobras petro-bras(PBR; com) – Brazil – 2.55 MMBoepd – EV $132 billion
  9. Lukoil luk-oil(LKOH; com) – Russia – 2.40 MMBoepd – EV $36.2 billion
  10. Total total(TOT; com) – France – 2.35 MMBoepd – EV $136 billion
  11. Statoil stat-oil(STO; com) – Norway – 1.81 MMBoepd – EV $63 billion
  12. Eni eni( E; com) – Italy – 1.69 MMBoepd – EV $74 billion
  13. ConocoPhillips conoco-philip(COP; com) – USA – 1.59 MMBoepd – EV $71.5 billion
  14. Surgutneftegas surgutneftegas(SGTZY; ru) – Russia – 1.49 MMBoepd – EV $8.5 billion
  15. CNOOC cnooc(CEO; com) – China – 1.36 MMBoepd – EV $397 billion
  16. China Petroleum & Chemical [Sinopec] sonopec(SNP; com) – China – 1.32 MMBoepd – EV $130 billion
  17. Oil and Natural Gas Corp.ongc (ONGC; com) – India – 1.07 MMBoepd – EV $23 billion
  18. Anadarko Petroleum adanako(ticker: APC; com) – USA – 840,000 Boepd – EV $43 billion
  19. Canadian Natural Resources canadian-natural-resources(CNQ; com) – Canada – 790,000 Boepd – EV $40 billion
  20. Devon Energy devon(DVN; com) – USA – 680,000 Boepd – EV $29 billion
  21. Ecopetrol ecopetrol(EC; com) – Colombia – 670,000 Boepd – EV $33 billion
  22. Occidental Petroleum oxy(OXY; com) – USA – 650,000 Boepd – EV $57 billion
  23. Suncor Energy suncor(SU; com) – Canada – 580,000 Boepd – EV $50 billion
  24. EOG Resources eog(EOG; com) – USA – 570,000 Boepd – EV $47 billion
  25. Repsol repsol( REP; com) – Spain – 560,000 Boepd – EV $33 billion

Quick Facts

  • USA is home to 28% of the largest companies, 21% of the group’s total production and 30% of the group’s total enterprise value.
  • Russia is home to 16% of the largest companies, 32% of the group’s production, and 7% of the total enterprise value.
  • China is home to 12% of the largest companies, 13% of production, and 30% of the group’s enterprise value.
  • Canada is home to 8% of the largest companies, 3% of production, and 3% of the enterprise value.
  • EU countries are home to 20% of the largest companies, 20% of production, and 21% of the enterprise value.

Methodology

Forbes’ author Robert Rapier said he screened the proprietary database of S&P Global Market Intelligence, “which includes 2,367 publicly traded companies across the energy sector, and from stock exchanges all over the world. If there were questions or uncertainties about the data (e.g., reported numbers were outdated) I used corporate earnings reports and presentations.”

Companies headquartered in Russia, the USA, China and the UK took the top five slots. (All data compiled by Forbes; production shown in barrels of oil equivalent for 2015: MMBoepd = million barrels of oil equivalent per day; EV = Enterprise Value).

Ref: http://www.forbes.com/sites/rrapier/2016/03/30/the-worlds-largest-public-oil-and-gas-companies/#20485c986cf1

Viewing all 497 articles
Browse latest View live


<script src="https://jsc.adskeeper.com/r/s/rssing.com.1596347.js" async> </script>