Quantcast
Channel: Drilling Formulas and Drilling Calculations
Viewing all 497 articles
Browse latest View live

Basic Sedimentation

$
0
0

After we’ve learned about the three types of rocks in the Earth, we will focus on sedimentary rocks because these are rocks which can be reservoir rocks. In this article, we will start with sedimentation and learn how this process creates sedimentary rock.

A process starting with erosion and transportation of eroded material to a deposition area is called sedimentation. Eroded particles settle out of suspension and are deposited into a layer form. With time, more layers form on top of the lower layers and press down onto the lower sedimentary layers. The compaction force pushes water out from the layers. Salt crystals glue sediment particles together and finally the sediments are lithified into sedimentary rocks – this is a part of diagenesis process. Figure 1 show the process of creating sedimentary rock. Stratification results from sedimentary particles arrangement in rock layers. For each rock stratum, there is a distinct layer of sediment and this is called “bedding.”

Figure 1 – Process of Sedimentary Rock

(Ref Image: http://www.eschooltoday.com/rocks/images/sedimentary-rocks-formation-process.png)

Diagenesis is a process of the modification of sediments into sedimentary rocks. Mineralogy and the texture of sediment are altered due to chemical and physical changes which convert unconsolidated sediment into rock.

The diagenesis process includes:

  • Physical compaction by extreme pressure – this step expels water from sedimentary layers
  • Growth of new diagenetic minerals
  • Dissolution of soluble elements of clastic rocks
  • Recrystallization and remineralization

Sedimentary rocks can be classified into 3 categories, which are Clastic, Chemical and Organic.

Clastic Sedimentary Rocks

Clastic sedimentary rocks are formed by mechanical weathering of existing rocks and some examples of clastic sedimentary rocks are breccia, conglomerate, sandstone, siltstone and shale.

Figure 2 – Conglomerate

(Ref Image – http://shorncliffe-rocks-bada.weebly.com/uploads/2/9/9/7/29976129/7806393_orig.jpg)

Chemical Sedimentary Rocks

Chemical sedimentary rocks are formed by a chemical process and some examples of chemical sedimentary rocks are salt, iron ore, chert, flint, some dolomites, and some types of limestone.

Figure 3 – Chert

( Ref Image: http://f.tqn.com/y/geology/1/S/r/y/flintnodin.jpg)

Organic Sedimentary Rocks

Organic sedimentary rocks are formed by an accumulation of animals and plants and some examples of organic sedimentary rocks are coal, some dolomites, and some types of limestone.
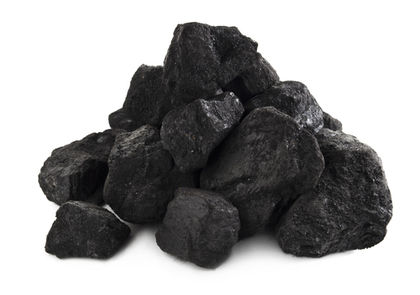
Figure 4 – Coal

(Ref Image: http://www.chemistryexplained.com/photos/coal-3347.jpg)

References 

Richard C. Selley, 2014. Elements of Petroleum Geology, Third Edition. 3 Edition. Academic Press.

Norman J. Hyne, 2012. Nontechnical Guide to Petroleum Geology, Exploration, Drilling & Production, 3rd Ed.. 3 Edition. PennWell Corp.

Richard C. Selley, 1997. Elements of Petroleum Geology, Second Edition. 2 Edition. Academic Press.


Clastic Sedimentary and Its Environments

$
0
0

Clastic sediment rocks are rocks which are formed from broken pieces of other pre-existing rocks by physical weathering. Then, rock particles are transported to lower lying areas. Mechanically eroded small pieces of rocks are usually formed in an angular shape because of a natural fracture point when erosion takes place initially.

When rock particles are transported, their shapes become rounded because of abrasion. Figure 1 demonstrates the shape of clastic particles. Furthermore, rock particles will be sorted due to conditions; for example, the flow rate of water transporting particles, size and weight of rocks, and the hardness of each rock. Eroded rock particles will be more rounded and well sorted as time progresses.  Figure 2 shows the definition of clastic particle sorting.

Figure 1 – Shape of Clastic Particles

(Ref Image: http://gs.sysu.edu.cn/Geoscience2008/english/content/chapter4/images/content_04_03_clip_image001.jpg)

Figure 2 – Sorting of clastic sedimentary rocks

(Ref Image: http://www.tankonyvtar.hu/hu/tartalom/tamop425/0038_foldrajz_mineralogy_Da/images/Fig_2_7.jpg)

Environments For Clastic Sedimentary

Alluvial

Alluvial environment includes meander belts on flood plains, river channels (fluvial), alluvial fans and alluvial plains. When water flows, it erodes substances from fast flowing regions and deposits the material in slow moving areas. So, channels will move over time due to this action. When channels move, a distinctive sedimentary sequence is built. Coarse sands / gravels are on the floor of a channel and fine particles, such as silts and clays are on top of the flood plan. This case is known as a fining upward alluvial cycle.

Desert

This environment is dry, so sand in a desert will be blown by the wind. This will result in sand dune formations (Figure 3) which are characterized, as well sorted sand, with cross bedding features.

Figure 3 – Sand Dune

(Ref Image: https://c2.staticflickr.com/6/5176/5419017309_3dc12d3d9c.jpg)

Deltaic

Deltas are formed where rivers meets the sea. Deltaic environment (Figure 4) has a mixed geological characteristic characterized by deposit patterns of alluvial freshwater and fossiliferous marine life.

Figure 4 – Deltaic Environment

(Ref Image: http://w3.salemstate.edu/~lhanson/gls214/images2/delta_struct.gif)

Beach and Bar

Beach and bar sands occur from wave motion and particles in this environment are typically well rounded and sorted. Bedding inclines toward the sea and oscillation ripples in a surf zone.

Shallow Marine

 Shallow marine environment is sedimentation on continental shelves, which is determined by tidal currents and wave bottoms.

Turbidite

Turbidite is formed by submarine slumps when sediment at the top slope is dislodged and moves as a turbid flow down the slope.

Figure 5 – Diagram of Sedimentary

(Ref Image: https://classconnection.s3.amazonaws.com/900/flashcards/2771900/png/depositional_envmts1360714480033.png)

References 

Richard C. Selley, 2014. Elements of Petroleum Geology, Third Edition. 3 Edition. Academic Press.

Norman J. Hyne, 2012. Nontechnical Guide to Petroleum Geology, Exploration, Drilling & Production, 3rd Ed.. 3 Edition. PennWell Corp.

Richard C. Selley, 1997. Elements of Petroleum Geology, Second Edition. 2 Edition. Academic Press.

Good Document – An Introduction to Oil & Gas Drilling and Well Operations

$
0
0

One of my friends shares this slide, An Introduction to Oil & Gas Drilling and Well Operations. This slide is the educational material from the IOM3 Oil and Gas Division, UK (http://www.iom3.org/). This is show all the basic of drilling and well operation in very simple language term. Additionally, there are several images which help explain content in this document clearly. This is a very good document when you try to explain overall drilling and well operation to new team members who don’t have much oilfield experience. The subjects covered in this presentation are as follow;

•Why we drill wells
•The well life cycle
•UK Legislation
•Well construction:-
−Well design and construction
−Rig types
−Pipe handling and the drill string
−Drilling and drill bits
−Drilling fluid
−Cementing (including plugging and abandonment)
−Blowout preventer
−Directional drilling
•Well testing and evaluation
•Well completion
•Xmas tree
•Well intervention
•Well integrity

Some of contents are shown below;

Download here – http://www.iom3.org/sites/default/files/iom3_introduction_to_oil_gas_drilling_and_well_operations.pdf

Travelling Block Falling Down

$
0
0

Anything can happen in just a second while you working. This 1-minute VDO shows you what a catastrophe occurs in just a second.

From the vdo, it seems like the break did not work properly so everything hanging in the travelling block was falling down and hit the drillstring on the rig floor. It did not take long just about 12 second for this case to happen.

rig-failure-no-logo

We don’t have more details about this incident but we would like to share with you. Safety is very important when especially you work in the field where many types of machinery are being operated. . You must always look around and don’t trust any machine.

Lesson Learned from This Case

  • Always look for the escape routes.
  • Maintain integrity of machinery and ensure that they are always properly maintained.
  • Always check equipment before use it.
  • Always have a third eye to help spot any defect
  • Run away quickly if the situation could not be solved. Your safety is priority.

What Do You Thought about This Case?

Please feel free to share what you think about this one. Your valuable comment may help others in the future.

Safety First

$
0
0

Safety is one of core values in oil and gas industry. There are a lot of emphasizing on safety while you are in a work place as drilling rigs, production facilities, oil offloading tankers, etc. However, we can see in many situations that safety are not recognized or even considered.  There are several in everyday life where people don’t think about how to work safe or they think these situations are safe in their thoughts. Therefore, we would like to share some images which we would like to use them to raise safety awareness in every day life. Please feel free to share with your friends or colleagues. Moreover, if you have any comments, please feel free to share with us.

Safety is for everyone. Let’s work safe and help people work safe :)

Clastic Sedimentary Rocks

$
0
0

Clastic deposition covers about 75% of the Earth’s surface and clastic sedimentary rocks can be categorized into 3 groups based on grain size. Table 1 demonstrates grain size and type of sedimentary rocks.

Table 1 – Grain Size and Sedimentary Rock

 (Ref: http://www.takenote.it/blog/wp-content/uploads/2012/01/table13.jpg)


Fine Grained Sedimentary Rocks – Mudstone

Mudstone is a fine grain sedimentary rock and this is the most abundant type of sediments. Its grain size is less than 1//16 mm, so people cannot differentiate it with normal eyesight. Typical mudstones are siltstone, claystone and shale and the most common minerals are quartz, feldspar, calcite and clay. The fine grained rock can show the least about its formation because of a very small grain size. Mudstone is defined as sediment with a large component of clay sized material. Mudstone occurs due to slow settling from slow currents. This fine grain sediment is typically formed on blanketing ridges, continental shaves, seafloor, abyssal plain and in trenches.

Mudstone usually contains decayed  organisms, which can be a food source for worms, crustaceans, burrowing clams, etc. These small creatures eat organic matter and then excrete unused inorganic bulk. The process of reworking of organic material in mudstone is called “bioturbation.” This can create black shale, which is a good source of petroleum.

Figure 1 – Shale

(Ref image: http://ostseis.anl.gov/images/photos/oil_shale-600.jpg)

Medium Grained Sedimentary Rocks – Sandstone

Sandstone is classified on grain size, texture and chemicals in a rock and the easiest criteria to differentiate sandstone from other sedimentary rock is the grain size. Sandstone has a grain size range from 1/16 to 2 mm and it can be seen with normal eyesight.  Rocks in this group are quartz, sandstone, arkosic sandstone and greywacke.

Figure 2 – Quartz Sandstone

(Ref Image https://classconnection.s3.amazonaws.com/128/flashcards/765128/jpg/quartz_sandstone1331010912836.jpg)

Well sorted sandstone is defined when all grains are the same size. On the other hand, poorly sorted sand is sandstone with various grain sizes. The shape of sand grain can tell you how eroded the grain sands are. If you see sandstone’s grain with a more spherical (less angular) shape, you can imagine that this rock was eroded quite heavily and transported over a long distance.

Course Grained Sedimentary Rocks – Gravel and Conglomerate

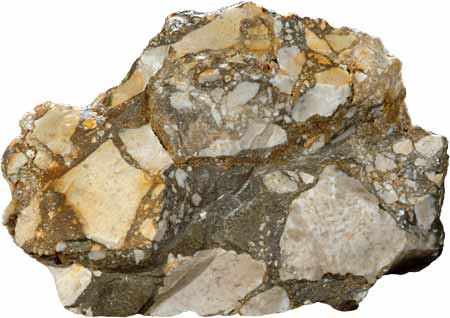
This type of rock has the biggest grain size, which is bigger than 2.0 mm and rocks in this category are conglomerate and breccia. Large sized rocks must be deposited by strong currents such as mountain rivers because it requires a lot of energy to move big and heavy rocks. Conglomerate (Figure 3) has a rounded shape because it has been transported with a high energy environment for a long period of time. However, breccia (Figure 4) has an angular shape because it is transported quickly.

Figure 3 – Conglomerate

(Ref Image: http://flexiblelearning.auckland.ac.nz/rocks_minerals/rocks/images/conglomerate2.jpg)

Figure 4 – Breccia

(Ref Image: http://flexiblelearning.auckland.ac.nz/rocks_minerals/rocks/images/breccia3.jpg)

References 

Richard C. Selley, 2014. Elements of Petroleum Geology, Third Edition. 3 Edition. Academic Press.

Norman J. Hyne, 2012. Nontechnical Guide to Petroleum Geology, Exploration, Drilling & Production, 3rd Ed.. 3 Edition. PennWell Corp.

Richard C. Selley, 1997. Elements of Petroleum Geology, Second Edition. 2 Edition. Academic Press.

Upstream Oil & Gas Overview Slides

$
0
0

IOM3 (The Institute of Materials, Minerals and Mining) share another good presentation about upstream oil and gas overview. This is an excellent document which will help people understand more about oil and gas industry. It may be too basic for someone; however, if you read it, there will be some parts that you may not know before. Furthermore, you can use this slide to educate new people or others from different disciplines.

overview-of-oil-and-gas-industry-FB

These are the topics covered in this presentation.

• What is Needed to Have An Oilfield?
• How Do We Find Oilfields?
• Seismic
• Types of Wells
• Well Drilling
• Types of Rigs
• Casing and Cementing
• Well Control
• Evaluation
• Oil in Place and Reserves
• Oil Field Development
• Economics
• Environment
•Oilfield Employment Impact

These are some captured screen from this slide.


If you are interested in this slide, please download here – http://www.iom3.org/fileproxy/416548


Geological Time Scales

$
0
0

Geological time scales help us to know the age of formations and three types of time scales are relative, absolute time and magnetic polarity scales. Relative time scale relates to an order in which a specific rock sequence occurs, but absolute time is an actual time that is derived from the chemical half-life of minerals in rocks. Magnetic polarity uses a concept of magnetic sequences to age the rocks.

Geological-Time-Scales

Relative Time Scale

Relative time scale started in the nineteenth century when geologists in Europe began to put together fossil records to see which one happened before or after another one. At that time, the geologists did not have a way to determine absolute time. Before the development of radioactive dating, geologists used a simple way to roughly estimate sedimentary rock ages.  For example, 1 km of sedimentary rock with 0.1 mm of accumulation per year: the estimated age of the sedimentary rock is 1 million years.

The relative time scale expresses in term of interval of relative time, like which rock comes first by studying about relationships between layers of sedimentary rocks and three important concepts of relative dating are as follows;

Biostratigraphy – Fossils in a rock bed are utilized to determine relative ages to other sedimentary planes.

Lay of original horizontality – Sediments laid by water are laid in horizontal or near horizontal plan.

Law of superposition – An older layer of rock lays beneath a younger rock bed.

These three concepts widely used to map layers of rocks which have a similar lithology and physical appearance, but there are some concerns about them. Firstly, typical sediments are not laid at uniform rate. Secondly, how many years have passed depositional periods which cannot be determined and finally, it is impossible to know the relative age of two similar rocks that are separated widely across beds.

Law of faunal succession is a law in geology that is about assemblages of fossil plants and animals that follow or succeed each other by a predictable time. This law is very important in stratigraphy because individual fossils can represent a relative timescale when geologists use each fossil to compare relative rock age. In petroleum exploration, it is common to use microscopic fossils or spores and pollen from plants to estimate the relative time of formations.  Figure 1 illustrates the geological timescale.

Figure 1 – Geological Time Scale

Absolute Time

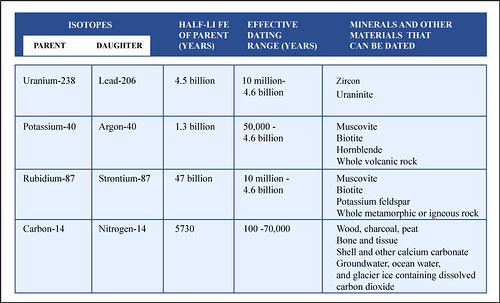
Using  relative time cannot give the exact date because there are several uncertainties and flaws in assumptions. Radioactive sources were discovered in 1896 and were introduced to use in determining age of rock in 1905 by Earnest Ruthford. The concept of the radioactive method is to utilize the radioactivity level in rocks to calculate the age of each rock.  Unstable radioactive isotopes decay into stable isotopes over their half life.  Potassium 40 (parent isotope), for instant, will decay to Argon 40 (daughter isotope) in about 1.3 billion years and its effective dating range is between 50,000 – 4.6 billion years. Table 1 shows major isotopes used in radiometric dating.

Table 1 – Major Elements Used in Radiometric Dating

Absolute geological time given from the radiometric dating method is often integrated into relative geologic time (Figure 1) to help users understand the timing of the relative time scale. Please remember that these dates can be changed depending upon updated information.

One example of radiometric dating is to determine the age of the Earth. The oldest sedimentary rock based on radioactive material is 4.1 billion years old, so it can be implied that the Earth must have been formed before 4.1 billion years ago

Magnetic Polarity Time Scale

The direction of magnetic polarity of the Earth is recorded in hot lava when it becomes solid and then crystal after the cooling process. This will create magnetic sequences on either side of diverging faults. Magnetic polarity can be reversed from normal polarity several times, so it is a very a very useful way to date rocks. A period of normal polarity and reverse polarity is termed as magnetic chrons.

If sedimentary rocks have magnetite material, it will have it owns magnetic direction. The magnetite material will align its particles naturally with the Earth’s magnetic field when the sediments settle. Thus, the sedimentary rocks will have a low magnetic alignment. Only magnetic reversal cannot be utilized alone to date the rocks because another reversal magnetic can have the same look. It is imperative to discover a continuous sequence and use this information along with other sources of dating information as fossil records to determine the precise age of formation.

References

Richard C. Selley, 2014. Elements of Petroleum Geology, Third Edition. 3 Edition. Academic Press.

Norman J. Hyne, 2012. Nontechnical Guide to Petroleum Geology, Exploration, Drilling & Production, 3rd Ed.. 3 Edition. PennWell Corp.

Richard C. Selley, 1997. Elements of Petroleum Geology, Second Edition. 2 Edition. Academic Press.

http://www.kgs.ku.edu/, (2015), Geological Time Scale [ONLINE]. Available at:http://www.kgs.ku.edu/Extension/gifs/color_time_scale_2013.png [Accessed 26 October 15].

Summons, Roger, (2007), Major Elements Used in Radiometric Dating [ONLINE]. Available at:http://c2.staticflickr.com/4/3566/3588634881_a0cefbe601_z.jpg [Accessed 21 October 15]


Organic Matter to Form Source Rock

$
0
0

Oil and gas that we are drilling today comes from a biogenic origin and it is formed with proper time and temperature. Organic matter is one of the most important parts of hydrocarbon generation. This topic will give you an overview of how organic matter will be transformed to hydrocarbon.

Organic-Matter-and-source-rock-cover

Starting with plants and algae, take carbon (CO2) from the atmosphere and process it to form glucose and this starting process is called photosynthesis. Glucose is transformed into more complex organic compounds. Trees, for example will grow bigger because they use photosynthesis to convert into energy. When animals and trees die, the organic matter is typically oxidized and this will create CO2 and put water back into environment again.  However, in some situations when organic matter is buried quickly in areas where there is no oxygen, the organic matter may be preserved. If the organic matters are buried in proper conditions, petroleum may be formed.

When organic matters die and accumulate in sediment areas such as as lakes, swamps or the ocean, these will be potential source rocks under some circumstances. If the organic matter is in a high oxygen area, it will be destroyed due to the oxidization process and there will be no chance of hydrocarbon generation. Therefore, it is critical to preserve organic matter from oxygen and there are some situations which will enhance organic matter preservation as listed below;

  • High sedimentation rate
  • Non-oxygen environment
  • Find grain sized bites of sediment that will prevent oxygen to penetrate into organic matter

Figure 1– Conditions for organic matter sedimentation to become source rocks

These conditions above are found in fine grained limestones and shale. Fine sedimentary rocks with preserved organic matter are common source rocks for petroleum.

Three factors that affect the amount of petroleum generation are as follows;

  • Quantity of organic matter
  • Nature of organisms preserved in sediments
  • Environment (pressure, temperature and time) to cook organic matter

For shale to be a good source rock, it must contain organic matter of at least 0.5% by weight. In some areas, organic content is greater than 50%, it is classified as gas / oil shale and this is referred to as unconventional petroleum resources.

References

Richard C. Selley, 2014. Elements of Petroleum Geology, Third Edition. 3 Edition. Academic Press.

Norman J. Hyne, 2012. Nontechnical Guide to Petroleum Geology, Exploration, Drilling & Production, 3rd Ed. 3 Edition. PennWell Corp.

Richard C. Selley, 1997. Elements of Petroleum Geology, Second Edition. 2 Edition. Academic Press.

USGS, (2013), ormation of organic-rich sediment layer [ONLINE]. Available at: http://energy.usgs.gov/portals/0/Rooms/geochemistry_research/images/first_stage.gif [Accessed 14 October 15].

Carefully Think About Oil and Gas Industry Before Boycott Us

$
0
0

We are working in oil and gas industry and many times we see many media, NGO’s, people want to ban oil forever. They make themselves look like heroes when they want to save the earth. However, this is totally impractical as you know. The Oil and Gas Industry is one of the biggest businesses in the world and without oil and gas industry many businesses will not be able to operate. People are a consumer of oil & gas both direct and indirect way, so we are relying on this industry.

ban-oil-and-gas-industry

 If you meet people who think oil and gas is a bad business for them so you need to tell them to stop using oil and any related products. It is very simple! Following are few easy steps which you can show them in order to stop Oil & Gas industry and make positive impact on the climate change.

  1. Sell their cars and motorcycles and then change to electric cars. This will help CO2 However, they need to remember that parts of vehicles contain some compositions of petroleum products. Basically, they need to stop using cars at all.
  1. Shut off water supply in their house. Energy requires producing and supply water to their houses mainly come from coal, oil and gas. It is time to save water from rain so they will have water to use all year around.
  1. Turn off heaters. The homes located outside tropical region are heated by fuel oil, propane or natural gas, and all this comes from the Oil & Gas industry. Instead make use of wood stoves for cooking and heating.
  1. Stop using mobile devices since most of materials in mobile phones are made of oil and gas product in some source.
  1. Stop eating farm food. All farming needs oil to run engines to grow fruits and vegetables, and/or to feed cows, pigs, chicken, etc. They may try to be self-sufficient by growing vegetables, feeding pigs, chicken and many more.
  1. Even better would be parking their vehicles and riding bicycle or horse instead. The people who live in cities should use bicycles as there isn’t enough space for horses in cities. Walking will also be another option for transportation.
  1. Stop travelling to the destinations by cars or air planes. The vehicles and planes are very inefficient and they produce very large amounts of emission.
  1. Disconnect their houses from electricity systems. A major portion of the electricity produced today is produced by burning coal, oil or natural gas. As you can see in Figure 1, coal, oil and gas are main energy sources of the world today. They will not be able to use their computer, TV, air conditioner, or microwave but think of positive impact it would have on environment.

Figure 1 – Global Energy Sources 2014

(Ref Image: http://www.euanmearns.com/wp-content/uploads/2015/06/globaenergy2014.png)

  1. Stop wearing the clothes that are made of the synthetic materials such as rayon or polyester. Those are the by-products of oil. Silk, cotton and wool seem to be petroleum free but all of them require energy in some sources to produce them. Basically, they are very limited to wear any clothes.
  1. Eliminate all plastic usage. Don’t forget that plastic is also a by-product of oil, so stop using the products that are made of plastic. Use the wood bowls and the wood fired clay pottery for eating and cooking.

We simply put few thought for people who don’t see any advantage of oil and gas industry and want to stop this industry and go green.  In reality, it is impossible to get rid of oil and gas industry at all if we would like to live in comfort conditions nowadays.

The problem which majority of people, especially NGO’s, has is that they don’t know the truth. It is easy to listen and believe in bad news instead of understanding the real situations. As you know, many companies both upstream and downstream try very hard to preserve our environment. Therefore, one of our tasks is to educate them to understand about our industry. You can show some examples of how oil and gas is essential for them. It is impossible for us to live in the modern world without oil and gas industry.

Please feel free to put any of your thought in the comment below.

Spectacular Oilfield Calendar 2016 – Free Download

$
0
0

This year, 2015, is one of the toughest years in oil and gas industry because oil price drastically drops than anybody can imagine. We wish in 2016 this will be a great year for us. We create a calendar for 2016 that you can download for free. Each image has 1600 pixels in width and 1200 pixels in height.

We wish you would enjoy our special oilfield calendar 2016. Please feel free to share with your friends, colleges, family members, etc.

January 2016

February 2016

March 2016

April 2016

May 2016

June 2016

May 2016

August 2016

September 2016

October 2016

November 2016

December 2016

Note: All images are legally bought from Shutterstock and Istockphoto.

What is Kelly Rig?

$
0
0

This is the brief explanation of a Kelly rotating system on the rig. Kelly rig is on an old style rigs and  nowadays it is mostly used on land operations. For offshore operation, a top drive system is used instead.

First of all, it is important for new people to look at these images before reading the information below because they show the equipment’s name and where they are on the rig.

(Ref Inage: http://www.cdc.gov/niosh/face/images/03ok034c.jpg)

(Ref Image: http://geologie.vsb.cz/DRILLING/drilling/theory/theory_html_m61697c8b.jpg)

(Ref Image: http://ffden-2.phys.uaf.edu/212_spring2011.web.dir/Dan_Luo/picture/hoisting.png)

The upper end of the drill pipe is screwed onto the saver sub. The saver sub is used to protect and minimize wearr and tear on the threads at the bottom of the Kelly. The Kelly is about 40 ft in length with a square or hexagonal shape and it is hollow throughout in order to transport the drilling mud.  Kelly moves freely through a Kelly bushing even though the drill stem is rotated.

A Kelly cock valve is located at the top of a Kelly and it is a safety valve which can be closed to stop back pressure from coming back to damage other surface equipment.

A swivel attached to the hook does not rotate, but at the bottom part it supports the Kelly which is being rotated while drilling.  Drilling mud is pumped from a mud pump to a stand pipe manifold, Kelly hose and then to a gooseneck connection at a swivel.

A rotary table rotates a Kelly bushing and it simultaneously rotates a Kelly and a drill string and a drill bit. A rotary table has two main functions. The first one is to provide rotation to a drill stem and a bit and the second function is to hold slip in order to support the weight of a drill stem when it is not connected to a Kelly.

Generally, a rotary drive consists of  a chain and rotary-drive sprocket. A rotary-drive sprocket is a part of the draw-works. In other rig power systems, an independent electric motor or engine with a direct drive to a rotary table is utilized. For this case, the rotary is normally driven by a drive shaft instead of a chain and rotary-drive sprocket.

A master bushing severs its function as a rotary motion transmission from a rotary table to a Kelly. Additionally, it is a link between a slip and a rotary table.

A Kelly bushing (some people call “rotary Kelly bushing”) engages a master bushing via four pins and rollers inside a Kelly bushing to allow a Kelly to move up or down freely while it is rotated or in a static mode.

This video demonstrates how to make a connection via a Kelly system.

What was happened? Kelly was bent.

$
0
0

We just got photo from our friend sharing these images of Kelly which was bent from parted drillstring.
This is the details.

While working the stuck drillstem using the kelly rig system, maximum tensile load applied on surface was about 375 Klb (170 tonne)  and the over pull was about 155 klb (70 tonne) and then the drill pipe was suddenly parted. This resulted in the Kelly to pop out of rotary table and the swivel bail came out of the hook. Therefore, the Kelly fail down freely because there was nothing to hold it. The equipment went down with the Kelly which was bent due to falling action from the rotary table to outside of the rig floor. Fortunately, nobody got injured from this incident.

Kelly-Bent-Over-From-The-Rotary-Table-1 Kelly-Bent-Over-From-The-Rotary-Table-2

Kelly-Bent-Over-From-The-Rotary-Table-3

We don’t have more details about where it was happened but we can learn from this incident.

What Can We Learn?

  • Always stay away from the rig floor and derrick while working with high tension. Drillers must be responsible to clear all personnel prior to work the stuck drill string.
  • Ensure when working with high tension, the weakest part of the string must be exactly known. Don’t not apply tensile over what it should be.
  • Not only is the rig floor dangerous place, but also catwalk is very extremely dangerous. Everything can fall from the rig floor to the catwalk. If you are there, you will be likely injured.

What Is Your Thought?

Please feel free to share with us in the comment box below.

Basic Understanding about 3D Seismic for Petroleum Exploration

$
0
0

3D seismic is one of the most important techniques to help geologists and engineers to find out where possible hydrocarbon is below thousands of feet below the earth surface. Without 3D seismic technology, many oilfields cannot be discovered.

We’ve found this excellent which will give you some ideas of how 3D seismic works in order to help us find oil and gas. Additionally, we also provide the full video transcript to help someone to learn about this topic. We wish you would enjoy watching and learning from this VDO.


Full Transcript

3D-Siesmic-Basic

Planet Earth. If you look closer, you’ll see that a whole other world exist beneath the surface of land and sea. Layer after layer of rock structures go deep into the Earth’s crust, mile after mile. And trapped within these structures, along with other liquids and solids, you’ll often find deposits of oil and natural gas – the world’s two most important sources of energy. These famous fuels are in constant demand, because they make the world go round, day in and day out.

So, how do you find something that’s completely hidden beneath the Earth’s surface? It’s a mystery that people in the oil and gas industry are always trying to solve and for very good reason. Drilling for hydrocarbons is expensive and before they spend money on equipment and crews, exploration and production companies need a reliable strategy for pinpointing where to drill.

Geoscientists have a secret weapon called seismic exploration and it involves sending acoustic energy, which takes the form of wavelets into the ground to get a sound picture beneath the surface. It’s complicated, so let’s start with the analogy of bats. Bats can’t see very well, so they send out little waves of sound that bounce off of objects and then go back to their ears. It’s called sonar. It gives them what you might call a sound picture of their world. That’s a good example of how nature already uses a form of seismic acoustic imaging to locate objects. Doctors also use it for ultrasound imaging.

Geoscientists use man-made tools to make the sound wavelets, listen to them and then record them. When you want to know if oil and gas deposits are in a particular area, geophysical companies bring large trucks that have big vibrators on them. Most of the time this is what generates the acoustic energy or a vibration. They use geophones or very sensitive seismic microphones to hear the reflected sounds, but sometimes they set off small, buried charges. They set many geophones on the ground in a line and they are attached to a recorder inside another truck. The vibrators send thousands of wavelets down into all the different layers of the earth. Some of the wavelets bounce off of the boundaries between the rocks below the surface and are reflected back to the geophones that are waiting to record them. Each geophone along the cable sends the received wavelets to the recording truck, where they are recorded and stored.

How do the wavelets reach into the subsurface of the ocean? That’s offshore seismic and it just requires a different device to send out the wavelets and record those that are reflected back. Out at sea, a seismic crew works of a vessel with a specially designed backend, so it’s easier to lay floating cables or streamers. And all along the length of the streamers, microphones called hydrophones are attached one after another. Several of these hydrophones streamers are pulled behind the vessel at once. Acoustic sources are towed behind the vessel in front of the streamers and release compressed air, which creates the wavelets. These wavelets travel through the water and into the subsurface below, where just like on land, they bounce off the rock layers and then return to the hydrophones to be recorded.

Here’s what seismic looks like after it’s been recorded. Basically it’s a bunch of squiggles. There are still a few more steps to go before it begins to look like an actual picture of the Earth’s interior. Right now the data is still in its raw form. To get a picture that actually looks like the earth beneath us, the data has to be processed. It takes a large, supercomputing PC cluster to process the seismic data. These computers go through all the different traces made by the wavelets and filter out everything we don’t need, such as vibrations made by a tractor in a field nearby.

Using really amazing computer applications and working on state-of-the-art workstations, geoscientists can see the seismic data translated into a 3-D picture. You might be thinking, “I don’t see any oil and gas there”, but believe it or not, geoscientists can look at this process data with their trained eyes and make an informed decision about whether or not oil and gas deposits are in the geologic structures. Seismic data leads to a high percentage of drilling success with less risk to the environment. And in a world where the demand for oil and gas is increasing faster than the supply, good seismic information will lead to more affordable energy.

Mud Weight and Its Importance in Drilling

$
0
0

Mud weight or mud density is a weight of mud per unit volume. It is one of the most important drilling fluid properties because it controls formation pressure and it also helps wellbore stability. Mud weight is measured and reported in pounds per gallon (PPG), pounds per cubic feet (lb/ft3), or grams per milliliter (b/ml).
Mud weight is normally measured by a conventional mud balance; however, if you have some air inside a fluid phase, reading from the conventional mud balance will give you an inaccurate number. Therefore, the most accurate method to measure the mud weight is with a pressurized mud balance.

conventional mud balance

Conventional Mud Balance

Pressurized Mud Balance

Pressurized Mud Balance

The pressurized mud balance looks like the convention one, but it has a pressurized sample cup. When you press a mud sample into the cup, any gas in a fluid phase is compressed to a very small volume so the mud weight measurement is more accurate.

What will happen if there is insufficient drilling fluid density?

Well control

The well will be in an underbalanced condition so any formation of fluids – gas, oil, and water- will enter into the wellbore.

Wellbore collapse (wellbore instability)

Mud weight will provide pressure to hole back formation. If mud weight is too small, wellbore may collapse.

What will happen if the mud weight is too high?

Lost circulation

If the hydrostatic pressure from mud column exceeds formation strength, it will cause a formation to break. Once the formation is broken, drilling fluids will be lost into the induced formation fractures.

Decrease in rate of penetration

Heavier mud weight will result in slower ROP because of hold down effect. Practically, while drilling, low mud weight is used at the beginning and mud weight will be increased, as the well is drilled deeper in order to optimize ROP and mitigate well control.

Deferentially Stuck Pipe

Since there are differences between formation pressure and hydrostatic pressure, there will be a lot of chances that a drill string will get deferentially stuck across permeable rocks.

Formation damage

The more mud weight that is in the well, the more mud filtration invades into porous formations. The invaded mud will cause damage to formation rocks.

References

Andy Philips, 2012. So You Want to be a Mud Engineer: An Introduction to Drilling Fluids Technology. Edition. CreateSpace Independent Publishing Platform.

Ryen Caenn, 2011. Composition and Properties of Drilling and Completion Fluids, Sixth Edition. 6 Edition. Gulf Professional Publishing.


Viscosity of Drilling Mud

$
0
0

Viscosity describes a substance’s resistance to flow. High-viscosity drilling mud is typically described as “thick,” while low-viscosity mud is characterized as “thin”. In the oilfield, the following terms are used to describe drilling fluid viscosity and rheological properties. Two viscosities that will be described in this section are Funnel Viscosity and Plastic Viscosity.

 Funnel Viscosity

The funnel viscosity is timed in seconds of drilling mud flowing through the Marsh Funnel Viscosity. The Marsh funnel is easy-to-use equipment that is used to quickly check viscosity of the mud. The Marsh funnel is dimensioned so that the outflow of time of one quart of freshwater (946 cc) at a temperature of 70 F ± 5 F (21 C ± 3 C) in 26 ± 0.5 seconds.

Figure 1 - Marsh Funnel

Figure 1 – Marsh Funnel

For all drilling mud, especially oil-based mud, temperate has an effect on the viscosity of a base fluid. The base fluid will be less thick once the temperature increases. It means that the funnel viscosity will decrease. The funnel viscosity measures at only one rate of shear, but the temperature each time of measurement is not constant. This is the reason why the viscosity measured from the Marsh Funnel does not represent the true drilling mud viscosity.  On the drilling rig, this measurement of the mud viscosity is still useful because it is a quick and simple test for observing trends of drilling mud.  In order to use the funnel viscosity effectively, personnel must record the values frequently. Then looking at a trend of funnel viscosity, it will indicate if there is any issue with drilling mud. Please remember that only a single point of the funnel viscosity cannot tell you anything about a condition of drilling mud.

Plastic Viscosity (PV)

Plastic Viscosity (PV) is a resistance of fluid to flow.  According to the Bingham plastic model, the PV is the slope of shear stress and shear rate. Typically, the viscometer is utilized to measure shear rates at 600, 300, 200, 100, 6, and 3 revolutions per minute (rpm).

Figure 2 - Viscometer

Figure 2 – Viscometer

Inthefield,the plastic viscosity can be calculated by a simple calculation shown below.

Plastic Viscosity (PV) = Reading at 600 rpm – Reading at 300 rpm

The unit of PV is Centi Poise (CP).

For example, determine PV from these reading values from a viscometer.

Reading at 600 rpm = 56
Reading at 300 rpm = 35
Plastic Viscosity (PV) = 56 – 35 = 21 CP

Any increase in solid content in drilling mud such as barite, drill solid, lost circulation material, etc., will result in higher  plastic viscosity. In order to lower the plastic viscosity, solid content must be removed and it can be achieved by using solid control equipment and/or diluting drilling mud with base fluid. Fluid temperature will increase while drilling deeper therefore plastic viscosity of drilling mud will decrease because the viscosity of the base fluid decreases.

Normally, the higher the mud weight, the higher plastic viscosity will be. However, if there is an increasing trend of plastic viscosity with constant mud weight, it means that there is an increase in drill solid content in a mud system.  Moreover, if oil based mud is used, please keep in mind that water in oil based drilling fluid will act like a solid, and it will increase the plastic viscosity dramatically. It is very critical to ensure that amount of water in oil based mud is within the designed limit.

Several impacts of plastic viscosity on drilling operation are as follows;
Equivalent Circulating Density (ECD)

The more PV you have, the higher the ECD will be.

Surge and Swab Pressure 

The PV has the same effect as ECD. If the PV increases, surge and swab pressure will also increase.

Differential Sticking

A chance for differential sticking will increase, especially in water based mud, when the plastic viscosity increases because of increases in solid content.

Rate of Penetration (ROP)

The ROP will be directly affected by the plastic viscosity. Thicker mud will have bigger hold down effect than thinner mud. Therefore, it causes in reduction in ROP.

Yield Point (YP) of Drilling Fluids

$
0
0

Yield Point (YP) is resistance of initial flow of fluid or the stress required in order to move the fluid. It can be simply stated that the Yield Point (YP) is the attractive force among colloidal particles in drilling fluid. As per Bingham plastic model, YP is the shear stress extrapolated to a shear rate of zero.

Figure 1 - YP is a shear stress at zero shear rate.

Figure 1 – YP is a shear stress at zero shear rate.

Yield point can be calculated by the following formula.

Yield Point (YP) = Reading at 300 rpm – Plastic Viscosity (PV)
A unit of YP is lb/100 ft2.

You can determine the Plastic Viscosity (PV) by this formula.

Plastic Viscosity (PV) = Reading at 600 rpm – Reading at 300 rpm
For example, you have these values from the viscometer.

Reading at 600 rpm = 56
Reading at 300 rpm = 35
Plastic Viscosity (PV) = 56 – 35 = 21 CP
Yield Point (YP) = 35 – 21 = 14 lb/100 ft2

The YP indicates the ability of the drilling mud to carry cuttings to the surface.  Moreover, frictional pressure loss is directly related to the YP. Higher YP will result in larger frictional pressure loss.
For water base mud, the YP will be increased with the following items;

  • High temperature – the high temperature environment tends to increase the YP in the water based mud.
  • Contaminants such as carbon dioxide, salt, and anhydrite in the drilling fluids
  • Over treatment of the drilling mud with lime or caustic soda

For oil based mud, the causes of increasing in YP are listed below;

  • Drill solid – the more drill solid you have, the more the YP will be.
  • Treatment CO2 in the mud with lime (CaO) – The lime (CaO) will chemically react with CO2 to form Calcium Carbonate (CaCO3) which will increase the YP.
  • Low temperature – in the oil based system, the low temperate will increase the viscosity and the YP. Please keep in mind that this is opposite to the water based system.

Operational impacts of the YP are as follows;

Equivalent Circulating Density (ECD)

The ECD typically increases when the YP increases.
Hole Cleaning

Usually the larger diameter hole to be drilled, the higher the YP must be to support efficient hole cleaning.

Have You Seen How A Jack Up Rig is Launch into the Sea?

$
0
0

A jack up rig which is one of offshore mobile drilling units is widely used in shelf offshore drilling exploration and production. The unit consist of a buoyant hull fitted with jack up legs which can be raised up or down into the sea bed.

These videos are very fascinating to see because this is how shipyard launch brand new jack up drilling units into the sea. Some major components of a jack up rig such as hull, jack up legs, accommodation are fabricated when the unit is on land. One major component which is derrick will not be installed until a jack up is into the water.

launch-jack-up-rig

Please check these videos and feel free to give us any comment or your experience about this kind of operation in the comment below.

Gulf International Drilling

This event took place at PPL Shipyard in Singapore, The rig owner is OroNegro and operated by Vantage Drilling Company.

PPL Shipyard Jack Up Launching

Gel Strength and Operational Impact

$
0
0

The gel strength is the shear stress of drilling mud that is measured at a low shear rate after the drilling mud has been static for a certain period of time. The gel strength is one of the most important drilling fluid properties because it demonstrates the ability of the drilling mud to suspend drill solid and weighting material when circulation is ceased.

gel-strenght

How can gel strength is measured?

Gel strength measurement is made on viscometer using the 3-rpm reading, which will be recorded after stirring the drilling fluid at 600 rpm to break gel. The first reading is noted after the mud is in a static condition for 10 seconds. The second reading and the third reading will be 10 minutes and 30 minutes, respectively.

Why do we need to record the 3-rpm reading after 30 minutes?

The reason is that the 30 minute-reading will tell us whether the mud will significantly form the gel during extensive static periods like tripping out BHA or not. If the mud has high gel strength, it will create a high pump pressure in order to break circulation after the mud is static for a long time. Furthermore, increasing in a trend of 30-minute gel strength indicates a buildup of an ultra-fine solid. Therefore, the mud must be treated by adding chemicals or diluting it with fresh base fluid.

Causes of Increasing in Gel Strength of Water Based Mud

The following causes will lead to high gel strength in the water based mud.

  • Bacteria
  • Ultra fine solid
  • Salt
  • Chemical contamination such as lime, gypsum, cement, and anhydrite
  • Acid gases such as Carbon Dioxide (CO2), and Hydrogen Sulphide (H2S)

Causes of Increasing in Gel Strength of Oil Based Mud

For an oil based drilling fluid, there are several points that will cause high gel strength in the mud system as follows.

  • Over treatment with organic gelling material
  • Build up of fine solid particles in the mud

Operational Impact of Excessive Gel Strenght

Operational Impacts of gel strengths are as follows;

Circulating Pressure

Excessive gel strength will lead to high pump initiation pressure to break circulation after mud is in a static condition for a period of time. High pump pressure may result in formation fracture and lost circulation.

Cutting Suspension

Low gel strength indicates inability to suspend cuttings. It can lead to pipe stuck and hole pack off due to insufficient cutting suspension.

Barite Sag

Barite sag is a situation where barite cannot be suspended by drilling mud because of low gel strength. It can be seen that when large fluctuation of mud density coming out of hole.

References

Andy Philips, 2012. So You Want to be a Mud Engineer: An Introduction to Drilling Fluids Technology. Edition. CreateSpace Independent Publishing Platform.

Ryen Caenn, 2011. Composition and Properties of Drilling and Completion Fluids, Sixth Edition. 6 Edition. Gulf Professional Publishing.

What is Top Drive System?

$
0
0

A top drive is a big motor system which is hoisted in a derrick or mast of a drilling rig. A top drive is a modern rotating system which has been popular for many drilling contractors and oil operators. Top drives can be used on all types of rigs, from truck-mounted rigs to offshore rigs.

top-drive-system

Rotation provided to a drill stem is accomplished by a top drive. Therefore, a Kelly and a Kelly bushing are not required for a top drive system. Moreover, a master bushing and a rotary table serves as support for slip and weight of a drill stem and as a conduit for a drill stem to be raised or lowed into a wellbore.

Since a Kelly is not required, the length of each stand is more than a single joint. Typically, drilling with a top drive can be drilled with a stand of drill pipe which consists of 3 joints of drill pipes. A top drive can drill about 90 ft before making a connection, as opposed to 30 ft like a Kelly. A top drive system allows rotation and circulation while pulling out of a hole (back reaming). However, this operation cannot be performed with a Kelly system.

A top drive is attached to a dolly track acting like a guide rail in a derrick. This allows straight movement up and down while drilling and tripping.

This video below briefly demonstrates how a top drive is operated.

TDS-component1

Figure 1 – Basic Configuration of Top Drive

Figure 1 shows some components of a top drive.

A – Elevator

B – Bail or Link

C – IBOP (both manual and pneumatic operated)

D – Rotating Head

E – Top drive motor

F – Dolly Track

G – Hook

D – Travelling Block


Viewing all 497 articles
Browse latest View live


<script src="https://jsc.adskeeper.com/r/s/rssing.com.1596347.js" async> </script>