Quantcast
Channel: Drilling Formulas and Drilling Calculations
Viewing all 497 articles
Browse latest View live

5 Steps To Heaven in Petroleum Geology

$
0
0

The 5 Steps to Heaven, which are source, migration, reservoir, seal and trap, is one of the most important concepts of petroleum geology. This tells us how petroleum was formed, migrated and trapped in a reservoir. Please note that the 5 Steps to Heaven is valid for conventional petroleum resources.

5-Step-to-Heaven

Source

Typically, organic matter from animals and plants is oxidized and turned an organic matter into carbon dioxide and water. However, if organic matter is buried rapidly, it may be preserved and can be turned into petroleum. These following conditions enhance organic matter preservation.

  • High sedimentation rate
  • Fine grain size so oxygen will not be able to penetrate and oxidize the organic matter
  • Anoxic bottom water

These conditions are mostly found in shale and fine limestone, which are common source rocks.

Types of organic matter can be classified into three types.

Type 1 – Fresh Water Lake

  • Fine algae
  • H:C ratio about 1.6 – 1.8
  • Tends to be more oil with a low amount of gas

Type 2 –Marine Environment

  • Single cell plankton, algae and bacteria
  • H:C ratio about 1.4
  • Tends to be a mixture between oil and gas

Type 3 – Swamp

  • Land vegetation , spores, pollen and plant fragments
  • H:C < 1.0
  • Tends to be mostly gas or coal

type of organic matter

Figure 1 – Type of Organic Matter

Then organic matter will be chemically processed to transform it into source rocks and this process is called the “cooking process.” Three phases of maturation of organic matter are diagenesis, catagenesis and metagenesis.

Figure 2 – Organic Maturity

Diagenesis

  • Formation of kerogen type 1,2,3 depending on the type of organic matter
  • Begin during initial deposition at shallow surface
  • Non-biogenic reaction and biogenic decay aided by bacteria turns organic matter to methane, CO2, H2O and Kerogen
  • Depth < 1,000 m
  • Temperature < 60 C

Catagenesis

  • Maturation of kerogen
  • Temperature increases with depth.
  • Around 60 C oil starts to form from kerogen as the molecules are cracked.
  • Oil generation is between 60 – 160 C is called the “oil window”

Metagenesis

  • Higher temperature cracks liquid hydrocarbon molecule.
  • Gas generation is between 160 – 225 C.
  • Above 225 C only carbon remains in the form of graphite. No hydrocarbon is formed beyond this temperature.

Migration

Hydrocarbon migration is the second step and it is a movement from petroleum fluid from source rock into reservoir rocks. Two processes of petroleum migrations are primary and secondary migration.

Primary Migration

  • This is happened first when hydrocarbon migrate from source rock goes into reservoir rocks.
  • Primary migration is driven by pore pressure and can be both upwards and downwards direction.

Secondary Migration

  • This is the movement of hydrocarbon through the carrier and reservoir rock.
  • Buoyancy is a driven force for the secondary migration.

Primary and Secondary Migration

Figure 3 – Primary and Secondary Migration


Reservoir

A reservoir rock is a place where hydrocarbon migrates and is held underground. Reservoir rocks are sandstone, limestone, chalk, dolomite, etc. Reservoir size and shape depends on depositional environment.

Major effects on reservoir properties are as follows;

Porosity = % of pore space in a reservoir rock

Permeability = ability of rock to allow reservoir fluid to flow through

  • 1 – 10 md = fair sand
  • 10 – 100 md = good sand
  • 100 – 1000 md = very good
  • 1000 md up = excellent

Net to gross ration – ratio between effective reservoir to entire reservoir interval

Seal

Seal is an impermeable rock, which prevents hydrocarbon from passing through. Therefore, further migration of oil and gas is stopped. Typically, they are fine grain sediments such as shale and evaporite (salt). Additionally, deformed shale in a fault zone can be a seal.

Figure 4 – Salt dome as a trap

(Ref: http://myweb.cwpost.liu.edu/vdivener/notes/salt-dome-3.jpg)

Trap

 Traps are impermeable structures where hydrocarbon accumulates underneath. Two types of traps are as follows;

Structural Traps

 Structural traps are formed as a result of changes in the structure of subsurface. They may be caused by pure tectonic movement (fault and fold) or salt movement. Examples of structural traps are anticline, fault and salt dome trap.

Stratigraphic Traps

Stratigraphic traps occur where the reservoir itself is cut off up dip and no other structural control is needed. Changes in lithology may be caused by variations in original deposition or due to processing after deposition. Examples of stratigraphy traps are pinch out traps, reef traps and lens traps.


Figure 5 – Structural and Stratigraphic Traps

(Ref: https://rodrigonomics.files.wordpress.com/2011/08/structural-traps.jpg)

References

Richard C. Selley, 2014. Elements of Petroleum Geology, Third Edition. 3 Edition. Academic Press.

Norman J. Hyne, 2012. Nontechnical Guide to Petroleum Geology, Exploration, Drilling & Production, 3rd Ed. 3 Edition. PennWell Corp.

Richard C. Selley, 1997. Elements of Petroleum Geology, Second Edition. 2 Edition. Academic Press.

USGS, (2013), ormation of organic-rich sediment layer [ONLINE]. Available at: http://energy.usgs.gov/portals/0/Rooms/geochemistry_research/images/first_stage.gif [Accessed 14 October 15].


Rotary Friction Welding for Oilfield Drill Pipe

$
0
0

This is very interesting to see how the body of drill pipe and tool joint together using the rotary friction welding.

The friction welding or FRW is solid-state welding process which generates the heat using the friction between the work pieces in relative motion to each other, with addition of lateral force known as “upset” in order to displace and fuse materials plastically. Technically, no melt takes place and in the traditional sense friction welding isn’t a process of welding, rather it is a forging technique. Because of similarities between traditional welding and these techniques, it has become a commonly used term. The friction welding is used with thermoplastics and metals in a variety of automotive and aviation applications.

Benefits of Friction Welding

Combination of the quick joining times (on order of just few seconds), and the direct input of heat at weld interface, results in relatively smaller zones being affected by heat. Generally the techniques of friction welding are melt-free, which avoids the grain growth in the engineered materials, like high strength heat-treated steels. There is another advantage of this that motion tends to “clean” surface between materials that are being welded. This means that less preparation is required for joining them. During the process of welding, depending on which method is used, small metal or plastic pieces are forced out of working mass (flash). It’s a common belief that flash carries away the dirt and debris.

frictional-welding-no-youtube

Friction welding has another advantage that it allows the joining of dissimilar materials. It is especially useful in the aerospace, where it’s used to join the lightweight aluminum stock in order to high-strength the steels. Usually the huge difference in the melting points of these two materials makes it impossible to weld using the traditional techniques, and some kind of mechanical connection will be required. The friction welding gives a bond of “full strength” without any additional weights. Such bi-metal joins have other uses in nuclear industry as the steel-copper joints are very common in reactor cooling systems as well as in transport of the cryogenic fluids where the friction welding is used for joining the aluminum alloys to the stainless steel and high nickel alloy materials for the cryogenic fluid piping and the containment vessels.

Another use of friction welding is with thermoplastics. These act in fashion analogous to the metals under pressure and heat. The pressure and heat used on the materials is lower than that on metals, but this technique is used for joining metals to plastics with material interface being machined. For example, this technique might be used for joining the frames of eyeglasses to pins in the hinges. As lower pressures and energies are used, it allows for more techniques to be used.

The Rotary Friction Welding

Rotary friction welding is the standard method of the industry for various processes including the welding API drill rods and drill pipes, joining of spindles, axle cases and welding of piston rods. In this process one component is held still while other component spins and the two components are brought together.

This is a robust and flexible process. It is also tolerant to various qualities of the materials. Parameters involved in this process are rotational speed, the time and the force applied. Thompson has calculated the optimum parameters for each particular weld.

What is Porosity?

$
0
0

Porosity is one of rock important rock properties and it is a measure of pore space in a rock.

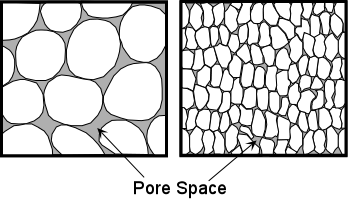
Figure 1 – Porosity

(Ref: http://www.tulane.edu/~sanelson/images/pores.gif)

Figure 1 shows the illustration of porosity and it can be seen that grain size and distribution can affect porosity of rock.

Porosity (ɸ) is mathematically expressed as a ratio of total void space with a rock to a total volume of rock.

Porosity (ɸ) = (Vp ÷ Vb) × 100

Where;

Vp = pore volume

Vb = bulk volume of rock

Porosity (ɸ) is shown in percentage form.

How To Measure Porosity

There are several methods to determine porosity as listed below

  • Direct methods: measurement from core flush by fluid or air
  • Indirect methods: well logging tools (density, neutron, and sonic)

Porosity (ɸ) can be classified into several types based on criteria;

Primary porosity: this is porosity in rock that was formed during sedimentation. Primary porosity depends on several factors, such as depositional environment, grain size & shape, distribution of sand grain, cementation between sands, etc.

Secondary porosity: This is formed during rock diagenesis. Chemical reaction dissolves rock grains and it results in void spaces in the rock.

Absolute porosity: It is a ratio of total pore space to a rock bulk volume. This will not account for voids which don’t connect to others.

Effective porosity: It is a ration of interconnected pore spaces to a rock bulk volume. This is a proper figure to use to calculate fluid volume in a reservoir

Example: A core sample is 5 cm long and 3 cm diameter. In the lab, vacuum, 3.25 cm3, of air is removed from the pore spaces.

1. What is the bulk volume of the core sample?

Bulk volume = (π÷4) × Diameter2 × Core Length

Bulk volume = (π÷4) × 32 × 5

Bulk volume = 35.34 cm3

2. What is the pore volume?

This is the volume of air vacuumed so pore space is 3.52 cm2

3. What is the porosity of the rock?

Porosity (ɸ) = (Vp ÷ Vb) × 100

Porosity (ɸ) = (3.52 ÷ 35.34) × 100

Porosity (ɸ) = 10 %

4. Is it effective or total porosity?

This is effective porosity because it measures volume of air that can be removed from the core.

References

Abhijit Y. Dandekar, 2013. Petroleum Reservoir Rock and Fluid Properties, Second Edition. 2 Edition. CRC Press.

L.P. Dake, 1983. Fundamentals of Reservoir Engineering, Volume 8 (Developments in Petroleum Science). New impression Edition. Elsevier Science.

Tarek Ahmed PhD PE, 2011. Advanced Reservoir Management and Engineering, Second Edition. 2 Edition. Gulf Professional Publishing.


Well Control

$
0
0

This page contains well control contents in this site.

well-control-in-one-page

Basic Calculation Related to Well Control

Adjusted maximum allowable shut-in casing pressure
Brine weight with temperature correction
Calculate Annular Capacity
Calculate Annular Pressure Loss
Calculate Equivalent Circulation Density (ECD) with complex engineering equations
Calculate Influx Height
Calculate inner capacity of open hole/inside cylindrical objects
Calculate Pressure Gradient and Convert Pressure Gradient
Calculate Specific Gravity (SG) in oilfield unit
Convert Pressure into Equivalent Mud Weight
Convert specific gravity to mud weight (ppg and lb/ft3) and pressure gradient (psi/ft)
Corrected D Exponent Calculation
D Exponent Calculation
Determine height of light weight spot pill to balance formation pressure
Determine the actual gas migration rate
Drill pipe pulled to lose hydrostatic pressure
Equivalent Circulating Density (ECD) in ppg
Equivalent Circulating Density (ECD) Using Yield Point for MW less than 13 ppg
Equivalent Circulating Density (ECD) Using Yield Point for MW More than 13 ppg
Estimate gas migration rate in a shut in well
Estimate Type of Influx (kick)
Formation Integrity Test (FIT) Procedure and Calculation
Formation Pressure from Kick Analysis
How does the 0.052 constant come from?
Hydraulic Horse Power (HPP) Calculation
Hydrostatic Pressure (HP) Decrease When POOH
Hydrostatic Pressure Calculation
Hydrostatic Pressure Loss Due to Gas Cut Mud
Kick Tolerance Calculation
Kill Weight Mud
Leak Off Test (Procedures and Calcuation)
Loss of Hydrostatic Pressure due to Lost Return
Maximum pit gain from gas kick in water based mud
Maximum Surface Pressure from Gas Influx in Water Based Mud
Pipe Displacement Calculation
Pump Output Calculation for Duplex Pump and Triplex Pump
Pump pressure and pump stroke relationship
Temperature Conversion Formulas

Drilling Mud Calculation (Related to Well Control)

Determine the density of oil and water mixture
Increase mud weight by adding barite
Increase Mud Weight by Adding Calcium Carbonate
Increase Mud Weight by Adding Hematite
Mixing Fluids of Different Densities with Pit Space Limitation
Reduce mud weight by dilution
Starting volume of original mud (weight up with Barite)
Starting volume of original mud (weight up with Calcium Carbonate)
Starting volume of original mud (weight up with Hematite)
Volume of mud in bbl increase due to adding barite
Volume of Mud Increases due to Adding Calcium Carbonate
Volume of Mud Increases due to Adding Hematite

Slug Calculations

Barrels of slug required for desired length of dry pipe
Weight of slug required for desired length of dry pipe with set volume of slug

Basic Knowledge Relating To Well Control

Abnormal Pressure Caused By Faulting
Abnormal Pressure from Anticline Gas Cap
Accumulator Capacity – Usable Volume per Bottle Calculation (Surface Stack)
Accumulator Capacity – Usable Volume per Bottle Calculation for Subsea BOP
Blowout – Oilfield Disaster That You Need to See
Bottom Hole Pressure Relationship
Bottom Hole Pressure with Constant Surface Pressure
Boyle’s Gas Law and Its Application in Drilling
Casing Shoe Pressure While Circulating Influx in Well Control Situation
Causes of Kick (Wellbore Influx)
Cement Transition Period in The Oil Well Can Cause Well Control Situation
Difference between True Vertical Depth (TVD) and Measured Depth (MD)
Effect of Frictional Pressure on ECD while forward circulation
Effect of Frictional Pressure on ECD while reverse circulation
Estimated mud weight required to safely drill the well
Factors Affecting Kick Tolerance
Gas Behavior and Bottom Hole Pressure in a Shut in well
Gas Behavior with Constant Bottom Hole Pressure
How Does 1029.4 Come From?
How to Predict Formation Pressure Prior to Drilling
Kick Tolerance
Kick Tolerance Concept and Calculation for Well Design
Kill Rate Selection
Kill The Blow Out Well Using Nuclear Bomb
Know about Swabbing and Well Control
Lag Time for Drilling Business and How to Calculate Theoretical Lag Time
Learn About Drill Pipe Float Valve
Learn about Maximum Surface Pressure in Well Control (MASP, MISICP and MAASP)
Let’s apply U-Tube concept
Lost circulation and well control
Maximum formation pressure that can be controlled when we shut the well in
Maximum influx height to equal the maximum allowable shut-in casing pressure
Maximum Initial Shut-In Casing Pressure (MISICP)
Pore Pressure Evaluation While Drilling Is Important For Well Control
Positive Kick (Wellbore Influx) Indications
Possible Kick (wellbore influx) Indications Part1
Possible Kick (wellbore influx) Indications Part2
Practice to drill the well at near balance condition in conjunction with well control precaution
Pressure Loss and Equivalent Circulating Density Review
Pressure Loss and Equivalent Circulating Density Review – Reverse Circulation
Review Hydrostatic Pressure and U-Tube Concept
Shut in Procedures and Their Importance
Surge Pressure, Swab Pressure and Trip Margin
Trip Margin Calculation
Understand about Friction Pressure Acting in Wellbore
Understand Hydrostatic Pressure
Understand the Formation Pressure
Understand U-Tube and Importance of U-Tube
Water Kick and Oil Kick Indications
Well Control or Blow out
What are differences between Full Opening Safety Valve (TIW valve) and Inside BOP valve (Gray Valve)?
What are differences between possible and positive well control indicators
What are the differences between FIT and LOT?
What is “Background Gas”?
What is “Connection Gas”?
What is “Drilled Gas”?
What is “Trip gas”?
What is a trip tank?
What is Flow Check?
What is Primary Well Control?
What is Secondary Well Control?
What is space out in drilling (especially in well control)?
What is Tertiary Well Control?
Why Do We Need To Minimize Influx (Kick)?
Why Was This Well Control Situation Happened?

Shut in Procedures

2 Types of Shut-In (Hard Shut In and Soft Shut In)
Determining Correction Initial Circulating Pressure
Post Shut-In Procedures while Drilling
Post Shut-In Procedures While Tripping -What data should be recorded?
Shut-In Procedure while Drilling
Shut-In Procedure while Tripping
Shut-In while Wireline Logging Operation

Surge and Swab Calculation

Determine surge and swab pressure for close-ended pipe
Determine surge and swab pressure for open-ended pipe
Determine surge and swab pressure method 2
Determine surge and swab pressure method 2 Calculation Example
Surge and Swab Calculation Method 1

Shoe Pressure While Circulating Kick

Shoe pressure when the gas kick is above a casing shoe
Understand shoe pressure – Shoe pressure when the gas kick Passing Shoe
Understand shoe pressure – Top of Gas Kick Below the Shoe

Well Control Equipment

Blow Through Situation in Mud Gas Separator (Well Control Equipment)
Design Factors Relating To Properly Design The Right Size of Mud Gas Separator for Drilling Rig
Drill string valves and IBOPs VDO Training
Mud Gas Separator (Poor Boy Degasser) Plays A Vital Role in Well Control Situation
Trip Tank and Its Importance on Well Control

Blow Out Preventer

4-Way Valve Operation in Blow Out Preventer Accumulator (Koomey) Unit
Accumulator (Koomey)
Annular Preventers
API Ring Gaskets Used in BOP Connections
Basic Understanding of Sub Sea BOP VDO Training
Blow Out Preventer (BOP) Equipment VDO Training
Blowout Preventers (BOP) VDO Training
BOP testing procedures
Calculate Bottles Required for Koomey Unit (Accumulator Unit)
Diverter Systems In Well Control
Mechanism of Accumulator (Koomey Unit)
Ram Preventers as Well Control Equipment
Reserve Fluid System and Pumping System in Koomey Unit
Understand More about Pipe Rams, Variable Bore Rams and Shear Rams
What is Closing Ratio in Blow Out Preventor (BOP)?

Driller’s Method

Advantages and Disadvantages of Driller’s Method
Bottom hole pressure change while performing well control operation with driller’s method
Circulate Kill Mud – 2nd Circulation of Driller’s Method
Circulate Out The Influx Holding Drill Pipe Pressure Constant
Driller’s Method in Well Control
Driller’s Method or Wait and Weight Method – What is The Practical Well Control Method for You?
Driller’s Method Quiz No. 1
Driller’s Method Quiz No. 2
Driller’s Method Quiz No. 3
Driller’s Method Quiz No. 4
Establish Circulation in Driller’s Method Step – 1
Float Bumping Procedures To Get Shut In Drill Pipe Pressure
How are pressure and pit volume doing during the first circulation of the driller’s method?
How is pressure doing for the second circulation of driller’s method
Lag Time and Its Importance for Well Control Operation
Shut Down And Perform Flow Check – Last Step of Drille’s Method
Shut Down Pumps and Weight Up Mud in Driller’s Method
Shut in the well and get pressure data (driller’s method)
Summary of Driller’s Method

Wait and Weight Methond (Engineering’s Method)

Advantages and Disadvantages of Wait and Weight Method
Drill Pipe Pressure Schedule Calculation for Wait and Weight Well Control Method
Formulas for Wait and Weight Well Control Method
How wait and weight method controls bottom hole pressure
Pressure Profile of Drillpipe and Casing Pressure while killing a well with wait and weight method
Slow Circulation Rate (SCR)
Wait and Weight Well Control Method (Engineer’s Method)

Volumetric Well Control

How To Perform Volumetric Well Control Method
Volumetric Well Control – When It Will Be Used
Volumetric Well Control Example Calculation

Lubricate and Bleed Well Control

Lubricate and Bleed in Well Control
Example of Lubricate and Bleed Well Control Calculation

Bullheading Well Control

Bullheading Well Control
Bullheading Calculation Example

Horizontal Wells Well Control

Introduction To Well Control for Horizontal Wells
Kick Scenarios in Horizontal Wells For Well Control
Kick Prevention for Horizontal Wells
Behavior of Gas in a Horizontal Well Kick

Deepwater Well Control

Choke Line Friction – How Does It Affect Deepwater Well Control?
Choke Line Friction Pressure as Kill Weight Mud Approaches the Surface
Fracture Gradient Reduction Due to Water Depth
Hard Shut-In Procedure while Drilling with a Subsea BOP Stack
How To Compensate Choke Line Friction For Deep Water Well Control
How To Measure Choke Line Friction (CLF) for Deepwater Well Control
Riser Margin – One of Important Concepts For Deep Water Drilling
Shut-In Procedure while Tripping with a Subsea BOP Stack

Stripping Well Control

Basic Understand of Stripping Operation Well Control with Gas Influx
Basic Understanding About Well Control With Pipe Off Bottom
Kick Penetration For Stripping Operation
Practical Considerations for Stripping Well Control Operation
Stripping Methods for Non Migration Kicks When There is an Off Bottom Well Control
Stripping Procedure with Volumetric Control For Migrating Kick
Stripping Procedure without Volumetric Control for Non-Migrating Influx
Stripping with Volumetric Control Steps and Example Calculation

Hole Monitoring Procedure

Hole Monitoring Procedures While Drilling or Milling Operation
Hole Monitoring Procedures While Running Casing
Hole Monitoring Procedures While Tripping

Ballooning in Well Control

How to Identify Well Ballooning
How to Prevent Well Ballooning
Well ballooning (wellbore breathing or micro fracture)

Useful Excel Files and Ebook

Download Wild Well Control Technical Book
Free BOP Drawing Template
Free Useful Well Control Spread Sheet – All Important Well Control Formulas For Oilfield Personnel
Trip Sheet Excel File
Well Control Kill Sheet Free Download
Well Control Tracking Sheet

Etc

Blow Out on The Rig Floor VDO
Oil Field Conversion Part 1 – Area, Circulation Rate, Impact Force
Well Control Acronyms
Well Control Formulas Part 1
Well Control Formulas Part 2
Well Control Formulas Part 3
Well Control Formulas Part 4
Well Control Formulas Part 5
Well Control Formulas Part 6
Well Control Procedure for Non-Shearable String
Well Flowing After Disconnecting The Wireline Lubricator – Well Control Situation (VDO)

Rock Compressibility

$
0
0

Compressibility is a relative volume change of a fluid or solid in a response to a pressure change. We can relate this into a reservoir engineering aspect. Overburden pressure is rock weight and it typically has a gradient of 1 psi/ft. Rock metric and formation fluid in pore spaces supports the weight of rock above. When petroleum is produced from reservoir rocks, pressure of fluid in pore space decreases, but overburden is still the same. This will result in the reduction of bulk volume of rock and pore spaces. The reduction on volume in relation to pressure is called “pore volume compressibility (cf)” or “formation compressibility” and it can be mathematically expressed like this.

rock compressibility equation

Where

Vp = pore volume

dVp = change in volume

dp = change in pressure, psi

cf = rock compressibility, 1/psi

Note: The actual measurement of rock compressibility is expensive and it is required to have a formation sample. In practical, utilizing Hall correlation to determine rock compressibility is acceptable.

Hall’s rock compressibility correlation is a function only of porosity. The correlation is based on laboratory data and is considered reasonable for normally pressured sandstones.

http://infohost.nmt.edu/~petro/faculty/Engler524/PET524-1c-porosity.pdf

rock compressibility equation 2

Rock compressibility factor is very important for reservoir modelling.

cf is typically in the range from 3 x 10⁻⁶ to 6 x 10⁻⁶ 1/psi.

Example

Use the following data to determine volume change in reservoir rock per 100 psi of pressure drop.

Reservoir area = 2,000,000 square feet

Porosity = 15%

Rock compressibility = 3 x 10⁻⁶ 1/psi

Formation thickness = 150 ft

Solution

Reservoir rock volume = 2,000,000 x 150 = 300 x 106 square feet

Vp = reservoir rock volume x porosity

Vp = 300 x 106 x 0.15 = 45 x 106 ft3

d Vp /dp = cf × Vp

d Vp /dp = 3 x 10-6 x 45 x 106 = 135 ft3/psi

dp = 100 psi

d Vp = 13,500 ft3

% change in reservoir pore volume @ 100 psi decline = dVp ÷ Vp =13,500 ÷ 45 x 106 = 0.03 %

References

Abhijit Y. Dandekar, 2013. Petroleum Reservoir Rock and Fluid Properties, Second Edition. 2 Edition. CRC Press.

L.P. Dake, 1983. Fundamentals of Reservoir Engineering, Volume 8 (Developments in Petroleum Science). New impression Edition. Elsevier Science.

Tarek Ahmed PhD PE, 2011. Advanced Reservoir Management and Engineering, Second Edition. 2 Edition. Gulf Professional Publishing.

Absolute Permeability

$
0
0

Absolute permeability is an ability to flow fluid through a permeable rock when only one type of fluid is in the rock pore spaces.  The absolute permeability is used to determine relative permeability of fluids flowing simultaneously in a reservoir.

Absolute-Permeability---cover

Darcy’s equation is widely used in an oil field to measure flow in porous media and the Darcy’s linear flow equation is shown below;

Darcy's equation

Equation 1 – Darcy’s Equation for Linear Flow


Figure 1 - Liner Flow Diagram

Figure 1 – Liner Flow Diagram

Where;

q = flow rate, cc/sec

k = permeability, Darcy (D)

A = cross sectional area to flow, cm2

μ = fluid viscosity, cp

Δp = pressure, atm

ΔL = length of fluid path, cm

For oilfield unit, the equation above is expressed below;

Equation 2 - Darcy's Equation (oilfield unit)

Where;

q = flow rate, stb/d

k = permeability, milli Darcy (mD)

A = cross sectional area to flow, ft2

μ = fluid viscosity, cp

Δp = pressure, psi

ΔL = length of fluid path, ft

Note: These equations (Equation 1 and Equation 2) represent a linear flow and a minus sign is in the equation because Δp is a minus figure so these two minus signs can cancel each other.

From the Equation 2, permeability can be expressed like this.

K

Where;

q = flow rate, stb/d

k = permeability, milli Darcy (mD)

A = cross sectional area to flow, ft2

μ = fluid viscosity, cp

Δp = pressure, psi

ΔL = length of fluid path, ft

Note: For a radial flow, we will go into details in later articles.

In 3-dimensional flow, permeability of each axis of low represents by the following signs;

kx – the permeability in the x-direction (horizontal permeability)

ky – the permeability in the y-direction (horizontal permeability)

kz – the permeability in the z-direction (vertical permeability)

kx and ky are parallel to a bedding plane of formation, but kz is perpendicular to a bedding plan.

Generally, horizontal permeability and vertical permeability has a significant level of difference. The variation in permeability in different planes is called Permeability Anisotropy. In reservoir modelling, it is quite common to have kx close to ky but, kz should be significantly different.

Reservoirs with layered formation have several permeability values, so these permeability values must be average to represent the whole sand package. There are two methods used to average permeability.

Thickness Weight Average

Equation 3 – Thickness Weight Average

Where;

kavg = average permeability

k = permeability of layer

h = thickness of layer

Geometric Mean

K avg

Where;

kavg = average permeability

How to Measure the Absolute Permeability

The absolute permeability is determined by flowing a single fluid of known viscosity through a core sample at a planned rate and different pressure. Then use Equation 1 to calculate the absolute permeability. This value will represent the answer only in a small scale because a core sample is so small compared to a reservoir’s size.

References

Abhijit Y. Dandekar, 2013. Petroleum Reservoir Rock and Fluid Properties, Second Edition. 2 Edition. CRC Press.

L.P. Dake, 1983. Fundamentals of Reservoir Engineering, Volume 8 (Developments in Petroleum Science). New impression Edition. Elsevier Science.

Tarek Ahmed PhD PE, 2011. Advanced Reservoir Management and Engineering, Second Edition. 2 Edition. Gulf Professional Publishing.

Types of Flow and Rheology Models of Drilling Mud

$
0
0

When you learn about drilling mud, the rheological models are essential knowledge. The rheological models are critical for a drilling fluid study because they are used to simulate the characteristics of drilling mud under dynamic conditions. With this knowledge, you will be able to determine some of the key figures, such as equivalent circulating density, pressure drops in the system, and hole cleaning efficiency.

The drilling fluid has three flow regimes, plug flow, laminar flow and turbulent flow and Figure 1 demonstrates 3 flow regimes on the shear rate and shear stress curve. In between each zone, there is a transition zone where the flow regimes are changing.

Figure 1 – Various flow types

Figure 1 – Various flow types

Plug Flow

Plug flow happens only with a very low shear rate and when the mud is in a gel stage. The velocity of the mud at the center of the annulus is equal to the velocity at the sides.

Laminar Flow 

The laminar flow usually occurs at a low flow velocity and it is best understood by considering mud as being layers of fluid flow. The velocity of the mud in the center is moving the fastest and the velocity of an adjacent layer moves slower. At the edge of the pipe, the velocity is very low when compared to the velocity in the center. For the laminar flow, the flow has a predictable pattern, and the shear rate is a function of the shear stress of the fluid.  Therefore, the equations used for the laminar flow are based on fluid flow models, such as Newtonian, Bingham Plastic, and Power Law.

Turbulence Flow

Fluid moving in a turbulence flow region is subject to random local fluctuations in both the direction of flow and fluid velocity. For the turbulent flow, it is difficult to find the proper equations to describe the fluid flow models because the flow at this stage is disorderly. Practically, most people use empirical equations to figure out the flow relationship for this flow regime.

Things to remember include that the drilling mud does not follow each particular fluid model exactly; however, either one or more fluid models can be utilized to predict the flow behavior of drilling mud and as a result it is still within a reasonable range.

Rheology models that you need to understand are Newtonian, Bingham Plastic, Power Law and Hershel-Bulkley.

Newtonian Fluid Model

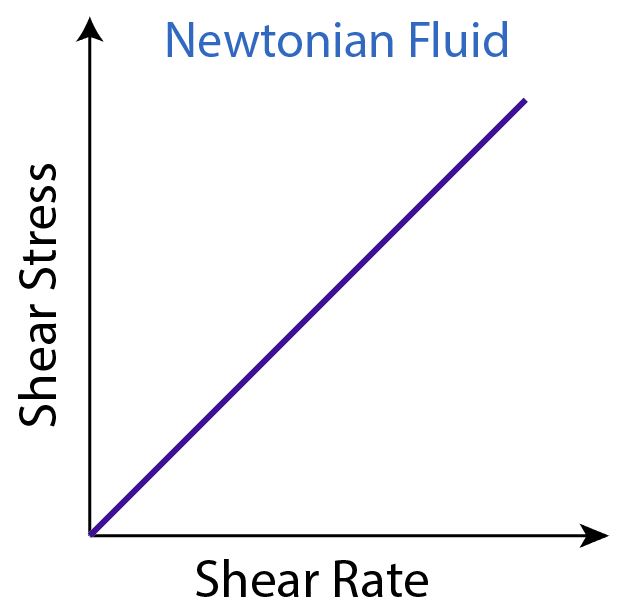
A Newtonian fluid model is the simplest model. Let’s describe it in a mathematical way, a relationship between shear stress (lb/100 ft2) and shear rate (1/sec), which is called a consistency curve, is a straight line which passes through the original (see the figure below).

Figure 2 - Newtonian Fluid Model

Figure 2 – Newtonian Fluid Model

What’s more, viscosity of the Newtonian fluid is the slope of the consistency curve.  The Newtonian fluid has a single viscosity value for every shear rate.

Which fluid is classified as the Newtonian fluid?

The fluid that has particles no larger than the fluid molecule can be applied to the Newtonian model to predict flow behavior. For example, light oil, water, and salt solution are all examples of a Newtonian fluid.

Newtonian fluid does not represent the behavior of drilling fluid because viscosity does not change by shear rate. However, drilling fluid is far more complex than a simple Newtonian fluid behavior and individual drilling fluids vary considerably in their flow behavior. The biggest difference between Newtonian fluid and drilling mud is the reactions between fine particle suspensions in the mud.

Figure 3 demonstrates differences between Newtonian fluid and drilling mud in a shear rate and shear stress plot. Two major points illustrated from the Figure 3 are as follows;

  • Curve of drilling mud is not in a straight line. It means that viscosity is not a constant value.
  • Shear stress is not zero at a zero shear rate.

In drilling fluid, there is some internal resistance to overcome in order to move fluid from a static condition. The graph (Figure 3) clearly shows that there is no fixed value for mud viscosity, but it tends to become lower as shear rate increases.

Note: viscosity = shear stress ÷ shear rate

Figure 3 - Drilling Fluid vs Newtonian Fluid

Figure 3 – Drilling Fluid Vs Newtonian Fluid

Bingham Plastic Model

The most commonly used fluid model to determine the rheology of non-Newtonian fluid is the Bingham plastic model. With this model, it makes the assumption that the shear rate is a straight line function of the shear stress. The point where the shear rate is zero is called “Yield Point” or threshold stress. Furthermore, the slope of the shear stress and the shear rate curve is called “Plastic Viscosity.” Bingham plastic model produces acceptable results for a drilling mud diagnosis, whereas, it is not accurate enough for hydraulic calculations.

Plastic Viscosity (PV) can be determined by the following formula;

Plastic Viscosity (PV) = reading at 600 rpm – reading at 300 rpm

Yield Point (YP) can be determined by the following formula;

Yield Point (YP) = reading at 300 rpm – Plastic Viscosity (PV)

Figure 4 - Bingham Plastic Model

Figure 4 – Bingham Plastic Model

Power Law Model

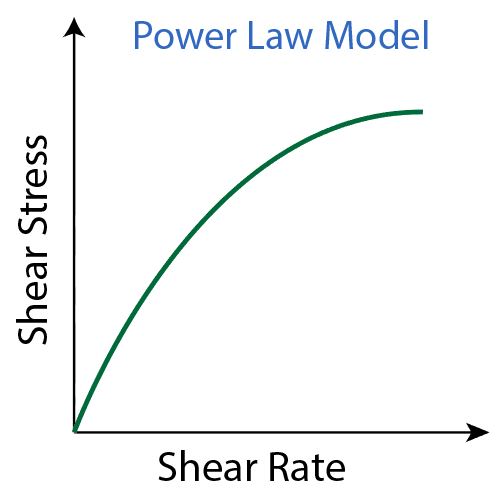
The power law model is another fluid model used to describe a characteristic of non-Newtonian fluid in which the shear stress and shear rate curve, called “a consistency curve,” has the exponential equation as described below:

Shear Stress = K x (shear rate)n

Where;

K is the fluid consistency unit.

n is the power law exponent.

Using a viscometer to measure shear stress at 600 and 300 rpm and use these figures to calculate n and K by these following equations.

n = 3.32 log (reading at 600 ÷ reading at 300)

K = 5.11 (reading at 300 ÷ 511n)

According to the equations, the relationship between the shear stress and the shear rate can be constructed like it is in Figure 5.

Figure 5 - Power Law Model

Figure 5 – Power Law Model

The drawback of the Power Law fluid model is that at zero shear rate, the shear stress is zero. This does not truly represent drilling mud because drilling mud has a residual shear strength at a zero shear rate.

Herschel Bulkley

The Herschel Bulkley is an improvement model from Power Law fluid model in order to match the actual behavior of drilling fluid at a low shear rate by assuming an initial shear stress value. Herschel Bulkley can be described as per the equation below;

Shear Stress = Yield Stress + K x (shear rate)n

Where;

K is the fluid consistency unit.

n is the power law exponent.

The yield stress is normally taken from value of 3 rpm reading and the n and K values are calculated from the 600 or 300 rpm values or they can be interpolated using mathematical method from a graph. Figure 6 represents the Herschel Bulkley Model.

Figure 6 - Herschel Bulkley Model

Figure 6 – Herschel Bulkley Model

Note: Newtonian fluid n = 1 and there is no shear stress at a zero shear rate. For drilling mud, n is always less than 1 and there is shear stress at a zero shear rate which is called “Yield Stress.”

References

Andy Philips, 2012. So You Want to be a Mud Engineer: An Introduction to Drilling Fluids Technology. Edition. CreateSpace Independent Publishing Platform.

Ryen Caenn, 2011. Composition and Properties of Drilling and Completion Fluids, Sixth Edition. 6 Edition. Gulf Professional Publishing.

Fluid Saturation

$
0
0

Fluid saturation is how much each fluid is present in pore spaces of a rock. This will affect the ability of each fluid flow through porous media. This is one of critical values for reservoir engineering since many engineering calculations need fluid saturation values.

fluid saturation

Fluid Saturation in Rock

Fluid saturation is expressed in terms of volume of fluid divided by total pore space.

Gas saturation (Sg) = Vg ÷ Vp

Oil saturation (So) = Vo ÷ Vp

Water saturation (Sw) = Vw ÷ Vp

Total saturation of fluid is equation to 1, therefore this can mathematically be expressed like this.

Sg + So + Sw = 1

Where;

Vg = volume of gas in pore space

Vo = volume of oil in pore space

Vw = volume of water in pore space

How To Measure Fluid Saturation

 Two methods to determine fluid saturation are 1) core sample and 2) wireline logging. Core sample is a direct method because it is a physical measurement. However, wireline logging is an indirect method because the values are derived from mathematical models.

Fluid Saturation Video by SPE

References

Abhijit Y. Dandekar, 2013. Petroleum Reservoir Rock and Fluid Properties, Second Edition. 2 Edition. CRC Press.

L.P. Dake, 1983. Fundamentals of Reservoir Engineering, Volume 8 (Developments in Petroleum Science). New impression Edition. Elsevier Science.

Tarek Ahmed PhD PE, 2011. Advanced Reservoir Management and Engineering, Second Edition. 2 Edition. Gulf Professional Publishing.


Rock Wettability

$
0
0

Wettability is a tendency of fluid to stick to the surface of formation when other types of fluid are present. Wettability of rock is measured by a core analysis in a laboratory and typically a laboratory measure contact angle between the fluid and the rock.

Wettability of rock is classified by the angle of contact, which is divided into 3 categories.

Water wet – contact angle (θ) is less than 90 degrees

Figure-1---Water-Wet

Figure 1 – Water Wet

Naturally wet – contact angle (θ) is equal to 90 degrees

Oil wet – contact angle (θ) is more than 90 degrees

Figure-2---Oil-Wet

Figure 2 – Oil Wet

Even though wettability will not be directly used in a material balance equation, it helps determine fluid distribution in a reservoir and potential flow restriction. Several rock properties have a direct relationship to wettability, for instant relative permeability, capillary pressure and electrical properties. When testing a core in a laboratory, it is very vital to consider the type of drilling fluid used in a drilling operation because it can change wettability of rock at the contact area in wellbore. Then, a result of testing will not be valid to use.

References

Abhijit Y. Dandekar, 2013. Petroleum Reservoir Rock and Fluid Properties, Second Edition. 2 Edition. CRC Press.

L.P. Dake, 1983. Fundamentals of Reservoir Engineering, Volume 8 (Developments in Petroleum Science). New impression Edition. Elsevier Science.

Tarek Ahmed PhD PE, 2011. Advanced Reservoir Management and Engineering, Second Edition. 2 Edition. Gulf Professional Publishing.

Capillary Pressure

$
0
0

Capillary pressure is a force due to differentials between fluid densities in a rock that can force pull hydrocarbon through the pores of a rock so a transition zone between fluids occurs.

Let’s make it simple. If we put a small tube in water overlaid by oil, water will rise up into the tube due to capillary pressure (Pc). For this situation, the capillary pressure (Pc) is the difference in pressure across the curved interface between the fluids (oil and water) shown in Figure 1.

Figure-1-Capillary-Diagram

Figure 1 – Capillary Diagram

Pc in Figure 1 can be expressed as

Pc = 2 × σwo × Cos (Ɵ) ÷ r   equation 1

Where;

σwo is interfacial tension between fluids.

Ɵ is a contact angle.

r is a radius of tube.

With the simple diagram in Figure 1, it demonstrates that smaller pore size (small r) will have a higher capillary pressure than bigger pore sized rock.

When fluid is in a static condition, then gravitational force equates to capillary force. Then, the capillary pressure can be defined as the difference between fluid densities.

Pc = (ρw − ρo) ×g ×h —- equation 2

Where;

ρw = water density

ρo = oil density

g = gravitational acceleration

h = water column height

Distribution of fluid in a reservoir rock depends on wettability phase saturation. It means than less wetting phase saturation will have a higher capillary pressure because it occupies small spaces of rock. Figure 2 shows a relationship between Pc and wetting phase saturation.

Figure-2---Capillary-Pressure-and-Sw

Figure 2 – Capillary Pressure and Sw

A reservoir with oil water contact will have a transition zone from free water zone (100% Sw) to connate water saturation, Swc, in an oil reservoir due to capillary pressure.

Figure-3---Transition-Zone-Diagram

Figure 3 – Transition Zone Diagram

Figure 3 demonstrates a transition zone diagram and height (h) of a transition zone above a free water level, and it can be calculated by the following equation.

h = (144 × Pc) ÷ (ρw − ρo)

h = transition zone height, ft

Pc = capillary pressure, psi

ρw = water density, lb/cu-ft

ρo = oil density, lb/cu-ft

This concept is very important because in some reservoirs that have oil water contact, there is no clear cut difference between oil and water because the capillary pressure creates a transition zone. The bigger transition zone may cut down the oil reserve in reservoir dramatically in some cases.

Example:  A core sample is tested to determine the capillary pressure. The capillary pressure at reservoir condition is 20 psi and the difference in density of servitor oil and water is 17.0 lb/ct. The rock has Sw of 30%. What is a transition zone height at Sw 30%?

h = (144 × Pc) ÷ (ρw − ρo)

h = (144 × 20) ÷ (17)

h = 169.4 ft.

As you can see from this simple calculation, the transition zone is almost 170 ft. If you have 600 ft of sand, 28% of the reservoir is in a transition zone.

References

Abhijit Y. Dandekar, 2013. Petroleum Reservoir Rock and Fluid Properties, Second Edition. 2 Edition. CRC Press.

L.P. Dake, 1983. Fundamentals of Reservoir Engineering, Volume 8 (Developments in Petroleum Science). New impression Edition. Elsevier Science.

Tarek Ahmed PhD PE, 2011. Advanced Reservoir Management and Engineering, Second Edition. 2 Edition. Gulf Professional Publishing.

Effective and Relative Permeability

$
0
0

When there is only one type of fluid flowing through porous media, the permeability for this case is called “absolute permeability.” However, when there is more than one type of fluids present in a rock, a permeability of each fluid to flow is decreased because another fluid will be moving in the rock as well.  A new term of permeability called “effective permeability” is a permeability of a rock to a particular fluid when more than one type of fluid is in a rock.

Reservoir consists of three fluids (gas, oil, and water) so these are commonly used abbreviations for effective permeability for each fluid.

kg = effective permeability to gas

ko = effective permeability to oil

kw = effective permeability to water

Normally, it is common to state effective permeability as a function of a rock’s absolute permeability. Relative permeability is defined as a ration of effective permeability to an absolute permeability of rock. The relative permeability is widely used in reservoir engineering. These functions below are the relative permeability of gas, oil, and water.

Relative permeability to gas – krg = kg÷k

Relative permeability to oil – kro = ko÷k

Relative permeability to water – krw = kw÷k

Where;

k = absolute permeability

Relative permeability is normally plotted as a function of water saturation in a rock (Figure 1). Figure 1 demonstrates a plot of oil-water relative permeability curves.

Figure-1---Relative-Permeability-Plot

Figure 1 – Relative Permeability Plot

As water saturation (Sw) decreases, relative permeability of oil (Kro) decreases and relative permeability of water increases (Krw). If water saturation is below connate water saturation (Swc), only oil will flow, but water will not flow (Figure 2).

Figure-2---Oil-flow-only-when-Sw-less-Swc

Figure 2 – Oil flow only when Sw < Swc

When water saturation (Sw) in a rock is equal to connate water saturation (Swc), water starts to flow (Figure 3).

Figure-3---Water-Starts-to-Flow

Figure 3 – Water Starts to Flow

Oil flow continues to decrease and water flow continues to decrease because the water saturation goes up. If water saturation (Sw) is between connate water saturation (Swc) and 1 minus Sor (irreducible oil raturation), both oil and water flow (Figure 4).

Figure-4---Both-oil-and-water-flow

Figure 4 – Both oil and water flow

Once water saturation in a rock increases to 1 minus Sor (irreducible oil saturation), oil will not flow, but only water will flow. Beyond this point oil will not move at all but water will continue to increase as water saturation (Sw) in a rock increases (Figure 5).

Figure-5---Oil-will-not-flow

Figure 5 – Oil will not flow

Applications of Relative Permeability

Relative permeability of rock is used to predict the flow of each fluid phase, displacement efficiency and expected recoverable reserves.

References

Abhijit Y. Dandekar, 2013. Petroleum Reservoir Rock and Fluid Properties, Second Edition. 2 Edition. CRC Press.

L.P. Dake, 1983. Fundamentals of Reservoir Engineering, Volume 8 (Developments in Petroleum Science). New impression Edition. Elsevier Science.

Tarek Ahmed PhD PE, 2011. Advanced Reservoir Management and Engineering, Second Edition. 2 Edition. Gulf Professional Publishing.

Three Types of Reservoir Recovery

$
0
0

Reservoir drive mechanism is the manner in which various energy sources in a reservoir  provide energy to flow fluids in reservoir to surface. Recovery of reservoir fluid is categorized into three categories (primary, secondary, and tertiary recover).

Primary Recovery

This is the first mechanism which is carried out by natural energy in a reservoir.

Figure-1---Primary-Recovery

Figure 1 – Primary Recovery

Secondary Recovery

This recovery is conducted by adding extra energy into reservoir for instant gas injection, water flood, etc. The extra energy is used to maintain reservoir pressure so a reservoir can produce effectively and yield more of a recovery factor.

Figure-2-–-Secondary-Recover

Figure 2 – Secondary Recover

Tertiary Recovery

Tertiary Recovery or Enhance Recovery is referred to as various methods to increase oil recovery. For example, a stream injection, carbon dioxide injection, polymer injection, etc. This recovery may change rock properties or inject non-reservoir gas to enhance efficiency of the ultimate oil recovered. Normal water or reservoir gas injection is not classified in this category. This is normally performed after the secondary recovery. However, in some areas, the tertiary recovery may be started after the primary recovery.

Figure-3---Tertiary-Recovery

Figure 3 – Tertiary Recovery

References

Abhijit Y. Dandekar, 2013. Petroleum Reservoir Rock and Fluid Properties, Second Edition. 2 Edition. CRC Press.

L.P. Dake, 1983. Fundamentals of Reservoir Engineering, Volume 8 (Developments in Petroleum Science). New impression Edition. Elsevier Science.

Tarek Ahmed PhD PE, 2011. Advanced Reservoir Management and Engineering, Second Edition. 2 Edition. Gulf Professional Publishing.

How the Top Drive System works

$
0
0

This video shows detailed about top drive from Varco with a lot of operation aspect and it will help you learn a lot of details about Top Drive. We already add full the VDO transcript in order to help people understand all details.

Full VDO Transcript

 TDS-system

The Varco Top Drive drilling system is more than a concept. It is a proven, practical drilling system that has been setting drilling records and producing profits for operators since the early spring of 1982. Time savings have averaged over 25% on the wells drilled with this system. In addition to reaching TD ahead of schedule, the operators feel that the ability to drill down 90 foot stands, produces a cleaner borehole and fewer subsequent sticking problems. By rotating the string from a drilling motor and gear train, mounted on rails and a derrick, the rig is able to function with the measure of speed, efficiency and safety; never before possible with conventional drilling methods.

The Top Drive’s flexibility to simultaneously rotate and hoist pipe at any time, whether drilling or tripping, can provide many previously unavailable options to drilling personnel. Development of this drilling system began several years ago, when after considerable investigation, Varco determined that the key to a successful derrick mounted drilling system would be found in the method of making and breaking connections overhead in the derrick. At that time, the technology did not exist to reliably handle this operation, but several years later with Varco’s hydraulic pipe handling tools proven successful, a second look was given the problem of breaking connections in the derrick. Initial designs utilized a railway traction motor, mounted in the derrick, rotating the string through a locomotive reduction gear and a hollow shaft, replacing the axel and flanged wheels.

The success of this design proved the concept and development continued to progress. Improvements were made to provide more torque and enabled a new drilling system to be used in the standard 142 foot derrick and on floaters with motion compensators. To increase the available torque, the railway traction motor was replaced with a square frame oilfield motor with special thrust bearings to enable it to run in a vertical position. And air break was fitted to the upper end of the double-ended armature shaft, and a new higher ratio reduction gear was designed. This change improved the available torque from the system, while short coupling the swivel to the drilling shaft and eliminating the hook, reduced the length sufficiently to allow it to be used in a 142 foot derrick.

The hook’s function was taken over by a series of features on the unit. First, the hook spring was replaced by springs located in the torque arresters to cushion the system, when the string was hoisted and allow the pin to jump the box, when connections were broken. Orientation of the elevators was accomplished by a positioning system located below the gearbox. Hoisting capacity of this system is a full, 500 tons, using standard links and a drill pipe elevator or casing tools. If a hook is desired in the system, a 147 foot derrick should be considered the minimum for adequate headroom. A hydraulic torque wrench is mounted beneath the drilling motor to break out connections at any point in the derrick. This tool is an adaptation of Varco’s proven successful TW60 torque wrench, hundreds of which are in use all over the world.

The Top Drive drilling system is mounted in a dolly, running on rails in the derrick structure. These rails may be incorporated into most existing derricks or mast with little or no additional reinforcement of the structure. The controls are built into the driller’s panel and are designed to be familiar to the driller, and ammeter and the tachometer, the only additional instruments, while the controls are usually integrated into the existing electrical distribution system; switches for breaks, link tilled inside BOP and torque limiter override, are placed for the convenience of the driller. In operation, the system allows drilling with 90 foot stands, which produces several distinct advantages over conventional drilling. By eliminating two of every three connections, a greater proportion of time is spent drilling ahead. When connections are made, they may be accomplished quickly, so as to maximize rotating time.

When a stand has been drilled down, the driller stops rotation and sets the slip. He then initiates the hydraulic pipe handler’s breakout sequence. The torque wrench elevates to engage the spline on the drilling shaft, the lower jaw clamps the box and the connection is rotated 30° to break. Next, the driller reverses the drilling motor to spin out of the string and hoists the system back to the monkey board, where the derrick man drops in the next stand. The new stand is hoisted and stabbed into the string, and the driller slacks off to stab the drilling shaft into the upper box. Both connections are spun up and torqued by the drilling motor, where the single tong holding back up at the floor. When the driller pulls the slips and starts the pumps and begins rotation, the system is making hole again.

Singles may be made up from the mouse hole just as easily. When the stand is drilled down, the slip set and the connection broken, the driller activates the link tilt feature to extend the elevators to the mouse hole, where they’re easily latched and the new joint is hoisted and stabbed into the string. The single is made up in the same way as the stand, and the system is drilling ahead in about a minute and a half from the time the slips were set.

Tripping is accomplished in the normal manner. With the drilling system in the string, the elevators simply handle the pipe in a conventional manner, except for the added advantage of the link tilt feature, which can be set to hand the stands to the derrick man. Should a tight spot be encountered, coming out or going in the hole, the driller stabs the drilling shaft back into the connection in the elevators, to rotate and circulate through the key seat or bridge. When tripping this ability to get back on the hole, is particularly important should a kick occur. Before the trip, a second inside BOP is made up on the drilling shaft. And should the driller notice a flow increase, or pit game during the trip, he simply sets the slips and stabs the drilling shaft back into the string, and makes up that connection as he would during routine drilling. At this point, he can close the pipe rams and readjust pressures on casing and drill pipe and begin the circulation of heavier mud. If necessary, he can close the remote operated kelly cog and lower the string to the floor, close the inside BOP and breakoff the drilling shaft to install this valve and steel hose. This operation does not require the presence of the floor crew to shut-in the well.

When running casing, the drilling system is left in place, and longer links and standard casing tools are suspended from the link adapter. As each joint is added, the driller can open the remote kelly cog and pump mud into the string through the short length of hose between the drilling shaft and the top of a casing. Should a tight spot be encountered, the spider slips are set and the elevator released, and the casing is stabbed into the casing swedge and made up. Now, the spider slips can be released and the casing rotated and reciprocated through the problem area.

The Top Drive drilling system provides the advantages of speed, efficiency, and safety, to the operator on practically any rig. The ability to drill with stands eliminates two thirds of the drilling connections, while providing a cleaner hole. Connections are made more quickly, since both upper and lower connections are spun up and torqued simultaneously. The link tilt features speeds latching the elevators on mouse holes connections, as well as extending stands of collars towards the derrick men on the monkey board.

Drilling with stands also facilitates directional drilling, coring, and fishing operations. Finally, additional efficiency is gained by the ability to rotate both drill pipe and casing through tight spots in the borehole. This system also provides considerable operating economy, simplicity of design, the use of common oilfield equipment, and the availability of parts, all contribute to the long-term economy of this system. The precise torque, applied to the drill string connections, contributes to their expected service life and the use of the remote kelly cog is a much safer valve during connections, preserves expensive drilling fluids.

Safety of men and equipment is the last advantage of this system, although it is probably the most important. By reducing the number of connections and eliminating several rotating members from the floor, while placing the entire operation in the hands of the driller, makes a significant contribution to the safety of the rig crew. Rapid and precise response to a kick situation enables the drilling system to contribute to the overall safety of the operation, giving the driller the ability to shut in the well and begin his control procedures without critical delay.

The Top Drive drilling system has proven itself to be not just an advanced concept, but a practical, reliable tool that is setting footage records wherever it is put to work. If you drill a well from the top down, why not drill it right? Drill it from the top with the Varco Top Drive drilling system.

This is the Varco power-sub drilling system, designed to rotate the drill string by means of an electric motor and gear drive, suspended in the derrick, the power-sub drilling system permits the driller to rotate the pipe while pulling out of the hole; and gives him the ability to drill down whole 90 foot stands. When drilling in a high angle hold, it’s occasionally necessary to rotate the string while pulling out to prevent the pipe from becoming stuck in the angled portion of the borehole. Drilling with 90 foot stands eliminates two kelly connections every 90 feet, thus saving some considerable time in the drilling operation.

The power-sub consists of a railway traction motor and gearbox, with a shaft replacing the axel and flanged wheel assembly. This widely available unit is mounted on end on a carriage to drive the drill string. The motor is offset from the string, thus no drilling fluid passes through it. The power-sub is placed in the overhead string, just below the standard swivel. Below the sub extends the pipe handler assembly. A hydraulic torque wrench used to break out connections from the power-sub either at the floor or in the derrick. Hanging beneath the pipe handler is a pair of standard Varco links and a drill pipe elevator. The links may be tilted out to reach the mouse hole with a built-in air system to assist the floor crew when picking up or laying down joints in the mouse hole.

The power-sub drilling system is designed to be compatible with any standard drilling system. The power-sub carriage assembly is mounted on a pair of rails in the derrick, similar to block guides. The drilling motor and the rest of the power-sub drilling system may be swung aside when not in use, and drilling with a kelly may proceed normally. To change from conventional drilling to power-sub drilling, the sub is swung from its stowed position and secured in the carriage. Meanwhile, the conventional kelly and swivel is set back in the rat hole. At this point, the hook picks up the power-sub by the swivel bail and the rig is ready to drill ahead or remount.

In practice, the rigs currently using the power-sub are leaving it in the string. Since the conventional elevators hanging below it, allow normal tripping. Here are Varco SSW30 hydraulic spinning wrenches being used to spin out the stand after breaking it with the tongs. In the same way, the trip in the hole can be made conventionally. Making connections while drilling is faster than conventional kelly connections. When the stand is drilled down, the slips are set. The torque wrench and the pipe handler begins its automatic cycle to break out the power-sub.

First, the wrench body elevates to engage the spline sub on the driveshaft. As the torque wrench clamps on the box connection, the torque cylinder rotate the connection 30° to break it out. Once this is done, the driller reverses the drilling motor to back the power-sub out of the box. Meanwhile, the crew has opened the elevators and they can be hoisted back to the monkey board, where the derrick man drops in the next stand and latches them. Now the driller hoists the stand and the crew stabs it into the box in the rotor. As the driller slacks off to stab the power-sub into the stand, he cracks the SER control, to rotate the drilling motor and spin up both connections. When the connections have shouldered, he dials up the prescribed current to properly torque the connections.

At this point, the string is hoisted, the slips pulled, circulation reestablished and the driller is ready to make another 90 feet of hole. When a turbo drill or a mud motor is used in a high angle hole, conventional drilling methods make it difficult to maintain a consistent weight on the bit. The power-sub drilling system allows the driller to rotate the string, while drilling with a mud motor to prevent wall sticking and maintain more accurate weight on the bit, for more consistent penetration.

A break on the drilling motor allows directional drilling with a mud motor and a bent set, and the ability to drill down 90 foot stands means fewer interruptions and loos of two-face orientation for fewer surveys, thus a considerable savings and drilling time. If single joints must be added too or removed from the string, a link tilt assembly lifts the elevators to the mouse hole to pick up or lay down the single. Drilling with stands is normally accomplished by picking up single joints in the mouse hole and assembling the needed stands prior to drilling. However, if additional footage is required, stands may be assembled while out of the hole; testing BOPs for example.

Finally, the ability to have what would normally be the kelly connection immediately available during trips, is likely to prove one of the most valuable features in the power-sub drilling system. Should the driller experience a kick while tripping, statistically one about half of all kicks occur, he needs only to stab the power-sub back into the string by slacking off, rotating and torqueing in the normal manner. That quickly he’s back on the kelly and able to pump into the well to reestablish reservoir dominants. Since connections are made quickly, stripping back in whole stands at a time needed, requires minimal interruption in pumping.

The first two power-subs delivered to Sedneth 201 and 202 proved the power-sub drilling system’s value to the contractor. The first unit set a drilling record on its first well, which was beaten on its second. The second power-sub on Sedneth 202 has performed just as well. Of the three wells, completed by the two power-subs, Sedneth 201’s first well required about 10 hours of downtime, due to some problems in the sub. Once the solution was found to these, the second well required less than two hours of downtime. And Sedneth 202’s first well required minimal interruption of drilling due to the power-sub. This is rather impressive, since these power-subs were still effectively prototype units, having never been previously exposed to actual drilling conditions. In this directional wells, torque was quite high and the physical stresses imposed on the system, particularly while drilling the surface hole, were extreme. The Setco drilling proved, drillers and rig superintendent and like, preferred the power-sub to the more conventional drilling methods with the kelly and rotary table for all kinds of drilling. They sighted the improved rate of penetration and time savings over the conventional drilling technique as the reasons for their preference.

This kind of performance, plus the support of Varco’s engineering and service departments, as well as the simple design and common oil field components, have produced the power-sub drilling system’s first satisfied customer. And we’re proud of that.

Please feel free to share if you like this video.

Solution Gas Drive Mechanism

$
0
0

Solution gas drive is a mechanism by which dissolved gas in a reservoir will expand and become an energy support to produce reservoir fluid. Solution gas drive has other name, such as dissolved gas drive or depletion drive.

When reservoir pressure is more than the bubble point, no free gas presents in a reservoir and this is called “under saturated reservoir.” At this stage, the drive comes from oil and connate water expansion and the compaction of reservoir pore space. Because compressibility of oil and rock is very low, only a small amount of fluid can be produced and typically the volume is around 1-2% of oil in place.

When reservoir pressure reaches a bubble point, oil becomes saturated and free gas will present in a reservoir. The expansion of gas is a main energy to produce reservoir fluid for the solution gas drive. At the beginning, the produced gas oil ratio will be slightly decline because free gas in a reservoir cannot move until it goes over the critical gas saturation. Then gas will begin to flow into a well. In some cases, where vertical permeability is high, gas may migrate up and become a secondary gas cap, which helps oil production.

When pressure gets lower, more gas will be produced and oil production will decline. This will lead to a high producing gas oil ratio. This is not a good sign because reservoir pressure declines sharply with gas production and eventually energy sources in a reservoir will drop and oil cannot be produced. Figure 1 shows general profiles of reservoir pressure, oil production, and Gas Oil Ratio (GOR) over a period of production.

solution-gas-drive

Figure 1 – Solution Gas Drive Diagram

This is very critical to perform the secondary recovery as water injection to maintain reservoir pressure above the bubble point so as to improve the oil recovery factor. Typical recovery factor from the solution gas drive reservoir is about 5 – 30%.

References

Abhijit Y. Dandekar, 2013. Petroleum Reservoir Rock and Fluid Properties, Second Edition. 2 Edition. CRC Press.

L.P. Dake, 1983. Fundamentals of Reservoir Engineering, Volume 8 (Developments in Petroleum Science). New impression Edition. Elsevier Science.

Tarek Ahmed PhD PE, 2011. Advanced Reservoir Management and Engineering, Second Edition. 2 Edition. Gulf Professional Publishing.

Gas Cap Drive Mechanism

$
0
0

Some reservoirs have a gas cap, which provides energy from gas expansion to help production from a wellbore; therefore, this is called “gas cap drive”. When oil is being produced, the gas cap expands and pushes oil downwards to a producing well (Figure 1).

Figure-1---Gas-Cap-Drive

Figure 1 – Gas Cap Drive

For this type of drive mechanism, it is imperative to keep gas within a reservoir as long as possible since it is an excellent energy source of the reservoir. Wells which are drilled into a high structure area where the gas cap is located must be closely monitored because this well will have more of a chance to produce gas.

When reservoir pressure declines, free gas will come out of a solution. If a well has good vertical permeability and the production rate is quite low, free gas will migrate and accumulate with an existing gas cap. This is an additional energy source to help production and ultimate recovery will improve. However, if a well produces at a high rate, free gas will be produced with oil and gas oil ratio (GOR) will go up; therefore, a well loses expansion energy from gas and the ultimate recovery will not be as high as it should be. Furthermore, with a high flow rate, gas will flow quickly into the oil because it has much lower viscosity than oil. So, this will create a situation called “gas fingering.”

For the gas cap drive, declining in production rate and reservoir pressure are slower than solution gas drive and ultimate oil recovery from this drive is around 20% – 40%.

Figure-2---Gas-Cap-Drive-Profile

Figure 2 – Gas Cap Drive Profile

References

Abhijit Y. Dandekar, 2013. Petroleum Reservoir Rock and Fluid Properties, Second Edition. 2 Edition. CRC Press.

L.P. Dake, 1983. Fundamentals of Reservoir Engineering, Volume 8 (Developments in Petroleum Science). New impression Edition. Elsevier Science.

Tarek Ahmed PhD PE, 2011. Advanced Reservoir Management and Engineering, Second Edition. 2 Edition. Gulf Professional Publishing.


Cement Calculator (Metric Unit) Excel Spreadsheet

$
0
0

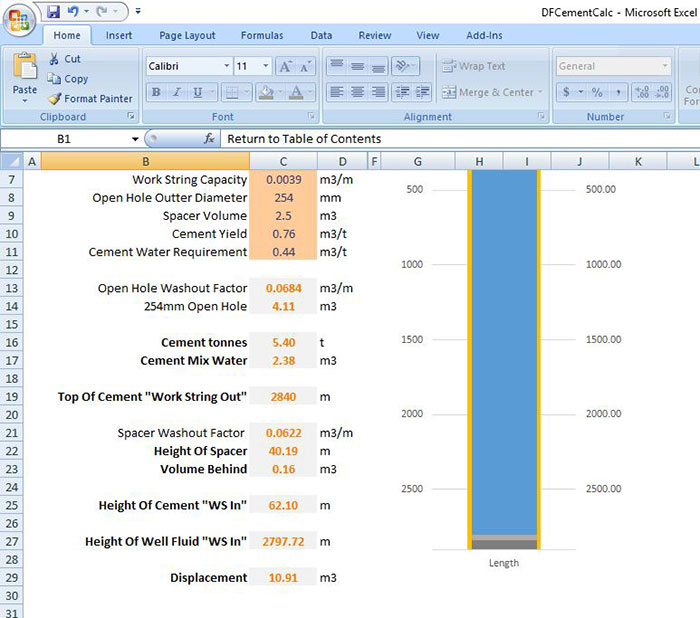
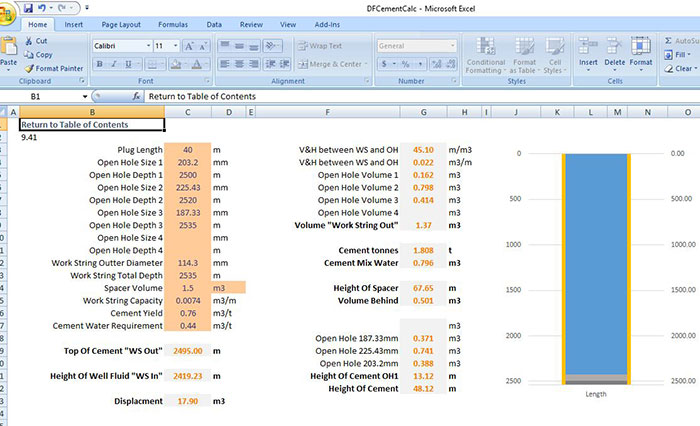
Jonathan Lukye who is a supervisor from Sanjel in Estevan, Saskatchewan, Canada shares his cement Excel spreadsheet. He has been working on a Metric Cement Calculator in Excel. In the Excel spreadsheet, it contains; Surface Cement, Intermediate / Production, Liner, Retainer, Plugs, Deviated Hole and Squeeze.

free-cement-calculator-metric-unit

The Surface, Intermediate and Liner Worksheets are “automatic” where there is no need for a handbook for factors as the sheet calculates them.  They also print out the job procedure for that sheet.

There’s also a page for Dimensions and Strengths as a reference.  And a Technical Data page for figuring out quick calculations.

Just a couple of quick tips, even though it’s evident what’s needed; The Surface, Intermediate and Liner worksheets require three worksheets to work, Main and the associated “Cap” page.  The rest of the Workbook relies on just input from the single worksheet.  The left side of the sheets are the “engineered” side, it will build what is required for that job and the top of the sheet compares the engineered side with what cement is on location and it will use the actual cement on location to build the job.  The Intermediate page has a weighted preflush calculator if needed.  If you print the surface, intermediate or liner sheets it will print the job procedure according to the input from the engineered and available parts of the sheet.  The charts, used as the well diagram, are dynamically sized using VBA so, these won’t resize on mobile devices as they don’t support VBA.

Every worksheet is protected but the Main and Dimensions and Strengths sheets are password protected as the sheets use those as reference and should not be altered.

Download the spreadsheet here ->Cement Calculator (Metric Unit) Excel Spreadsheet by Jonathan Lukye

Some screenshots are shown below.

Balance Cement Plug

Balance Cement Plug

Liner Cement

Liner Cement

Multiple Hole Cement

Multiple Hole Cement

Squeeze cement

Squeeze cement

Download the spreadsheet here ->Cement Calculator (Metric Unit) Excel Spreadsheet by Jonathan Lukye

Water Drive Reservoir

$
0
0

Some reservoirs have communication with a water zone (aquifer) underneath. When reservoir pressure drops due to production, the compressed water in an aquifer expands into a reservoir and it helps pressure maintenance. This mechanism is called “water drive”.

Water drive mechanism will be effective if an aquifer contacting reservoir is very large because water compressibility is very low. For example, an anticline structure with extensive water zone (aquifer) will have the most advantage from the use of a water drive mechanism. Conversely, stratigraphic reservoirs or highly-faulted reservoirs will have limited aquifer volume so water drive is insignificant.

Figure 1 - Water Drive Mechanism

Figure 1 – Water Drive Mechanism

Typically, characteristics of reservoirs which are influenced by water drive mechanism are a small pressure decline and a fairly constant producing GOR over a period of time. Small gas production comes from solution gas oil ratio (Rs) and producing gas oil ratio (Rp) is equal to solution gas oil ratio (Rs).

Water from an aquifer below a reservoir pushes oil towards producing wells and eventually producing wells will have higher water. When the percentage of water production is so high that production becomes not economic, this is called “water out.” Wells located at a low structure part will be watered out before wells are at a high structure. Watered-out wells are good candidates to convert to water injection wells for water flood operation.

Water drive mechanism is a very good drive and reservoirs can produce oil over 50% recover factors in many cases.

Figure 2- Water Drive Production Profile

Figure 2- Water Drive Production Profile

References

Abhijit Y. Dandekar, 2013. Petroleum Reservoir Rock and Fluid Properties, Second Edition. 2 Edition. CRC Press.

L.P. Dake, 1983. Fundamentals of Reservoir Engineering, Volume 8 (Developments in Petroleum Science). New impression Edition. Elsevier Science.

Tarek Ahmed PhD PE, 2011. Advanced Reservoir Management and Engineering, Second Edition. 2 Edition. Gulf Professional Publishing.

Oilfield is Beautiful – 15 spectacular images that will make you appreciate oilfield

$
0
0

Oilfield is beautiful.

Do you agree with us?

We would like to share 15 spectacular images that will make you appreciate the beauty of oilfield.

Semi submersible rig

Winter and Pump Jack

Well Test

Double Derrick Semi Submersible Rig

Aerial View of Offshore Rig

Pump Jack in Valley

Jack up Rig Move

Offshore Production Facility

Offshore Production Facility

Pump Jack and Sunset

Pump Jack and Sunset

Pump Jacks Keep Pumping

Pump Jacks Keep Pumping

Offshore Central Production Facility

Offshore Central Production Facility

Lighting in Oilfield

Lighting & Oilfield

Sunset Time & Jack up Rig

Sunset Time & Jack up Rig

The Horizon

The Horizon

Big Semi Sub Rig in Shipyard

Big Semi Sub Rig in Shipyard

What is Pumpjack?

$
0
0

Pumpjack (also known as donkey pumper, oil horse, pumping unit, nodding donkey, horsehead pump, beam pump, rocking horse, dinosaur, Big Texan, grasshopper pump, jack pump or thirsty birds) is overground drive for reciprocating the piston pump in oil well.

pump-jack

It’s used for mechanically lifting the liquid out of a well if there isn’t enough bottom hole pressure for liquid to flow to the surface. Commonly this arrangement is used for the onshore wells that don’t produce much oil. The pumpjacks are quite common in the oil rich areas.

Generally a pumpjack produces 5 – 40 liters of liquid with each stroke. It is often an emulsion of water and crude oil. Couple of factors on which the size of the pump is determined are the weight and the depth of oil that is to be removed. More power is required to move increased weight of discharge head (discharge column), in deeper extractions.

The rotary mechanism of motor is converted to vertical reciprocating motion by a pumpjack in order to drive pump shaft and it is exhibited in characteristic nodding motion. ‘Walking beam’ is the engineering term used for such a mechanism. This mechanism was often employed in the marine and stationary designs of steam engines in 18th and 19th century.

Above Ground:

In earlier days, the pumpjacks were actuated by the rod lines that used to run horizontally above ground to an eccentric wheel in a mechanism called central power. Central power could operate dozen or even more pumpjacks and it was powered by internal combustion or steam engine or by electric motor. One of the difficulties in this scheme was to maintain the system balance as the individual well loads changed.

A prime mover is used to power the modern day pumpjacks. It is usually an electric motor, but in some isolated locations that don’t have electricity access, the internal combustion engines are used. The common pumpjack engines are run on the casing gas that is produced from wells, but the pumpjacks have been run on different types of fuels like diesel and propane fuel. In the harsh climates, such engines and motors might be housed in a shack for the protection from elements.

A set of pulleys is run to transmission by the prime mover of pump jack. This drives pair of cranks, usually with the counterweights on them in order to provide assistance to the motor in lifting heavy strings of rods. One end of the I-beam is raised and lowered by the cranks. The I-beam can move freely on A-frame. There is a curved metal box on the other end of beam. This metal box is known as donkey head or horse head because of its appearance. The horse head is connected to a polished rod, piston which passes through stuffing box. This connection is via steel cable or sometimes fiberglass.

The polished rod has close fit to stuffing box which lets it move in and out of tubing without the fluid escaping. (A pipe which runs to bottom of the well and through which liquid gets produced is the tubing). The bridle follows curve of horse head as it raises and lowers to create an almost vertical stroke. A long string of rods known as sucker rods connects the polished road. This long string runs through tubing to down-hole pump and is normally positioned near bottom of the well.

Down-hole:

There is a down-hole pump located at bottom of tubing. There are 2 ball check valves in this pump. There is a stationary valve located at bottom known as standing valve and there is another valve on piston connected to bottom of sucker rods known as traveling valve. The traveling valve travels up & down as rods reciprocate. The fluid in reservoir enters from formation in to bottom of borehole via perforations which are made through cement and casing. (Casing is the larger pipe of metal which runs through the length of well. Cement is placed between casing and earth; pump, tubing and the sucker are all inside casing).

When rods at pump end travel up, travelling valve is closed and standing valve is open (because of the drop in the pressure in pump barrel). This results in pump barrel filling up with fluid from formation as travelling piston lifts previous contents of barrel upwards. When rods start pushing down, travelling valve opens and standing valve closes (because of increase in the pressure in pump barrel). Travelling valve drops via fluid in barrel (that was sucked in during upstroke). Then the piston reaches the end of the stroke and starts moving upwards again and the same process is repeated.

Often, gas gets produced via same perforations as oil. It can be problematic in case the gas enters pump because it may lead to gas locking. In gas locking an insufficient pressure gets built up in pump barrel to open valves (because of compression of gas) and very little or absolutely nothing gets pumped. In order to preclude this, inlet for pump can be placed below perforations. As fluid laden with gas enters well bore via perforations, gas bubbles up annulus (space between casing and tubing) while liquid moves down to standing valve inlet. Once at surface, gas is collected via piping connected to annulus.

The influence of the pumpjack:

The pumpjacks have had a positive effect on petroleum industry. The efficiency of the extraction process has improved. In many cases, the wells life is extended by many years by a pumpjack. This allows the operators to reach the oil which would remain untapped otherwise. The traditional oil extraction methods have been primary & secondary methods, which according to studies by US Department of Energy, exhaust only a quarter and half of the oil reserves of a well. Such profligacy was addressed by development of tertiary technique which is more commonly known as the enhanced oil recovery (EOR).

The pumpjacks also facilitates the low operational costs. The performance of a pumpjack can be remotely monitored by using smart technology. This means that there is no need to heavily man it. For the oil wells having low production, it is a huge benefit ensuring that the running costs don’t outstrip the oil supply levels.

Output of a pumpjack is different for each case. According to estimates the output can be anywhere between 5 to 40 liters of liquid per stroke. However, in reality, output depends on a number of different factors. How much fluid is there in pump bore? What is oil’s percentage in extracted liquid? How big is pumpjack and how many strokes it can reach per minute?

The pumpjacks aren’t exclusive to petroleum industry. They are also used on smaller scale for replacing the traditional techniques of hand pumping at the water wells.

Material Balance Equation in Reservoir Engineering

$
0
0

Material balance is a mathematic way to express mass conservation in a reservoir and a simple key principle is “what reservoir is produced must be replaced by other mass.

Volume Produced = Volume Replaced

Volume Produced comes from Gas Production, Oil Production, and Water Production.

Volume Replaced comes from volume expansion, water in flux and water/gas injection.

Figure 1 shows the relationship of the material balance.

Figure-1---Concept-of-Material-Balance

Figure 1 – Concept of Material Balance

Let’s take a look at each component of equation.

Volume Produced

Gas Production (rb) = Np (Rp – Rs) Bg

Oil Production (rb) = Np Bo

Water Production (rb) = Wp Bw

Total Production = Np [Bo + (Rp – Rs) Bg ] + Wp Bw

Volume Expansion

 Oil Expansion

Oil expansion consists of two parts. The first one is only oil expansion and the second one is solution gas expansion that happens when reservoir pressure is below a bubble point.

Oil expansion (rb) = N (Bo – Boi)

Solution gas expansion (rb) = N (Rsi – Rs) Bg

Total oil expansion (rb) = N [ (Bo – Boi) + (Rsi – Rs) Bg ]

Rock and Connate Water Expansion

Rock expansion (rb) = Vp ×Cf ×ΔP

Connate water expansion (rb) = Vp ×Swc× Cw ×ΔP

Total rock and connate water expansion (rb) = Vp ×(Cf + Swc× Cw)× ΔP

Pore Volume (Vp) = [ N× (1 + m) ×Boi ]÷ (1 – Swc)

total rock and connate water expansion

Initial Gas Cap Expansion

Initial gas cap volume (rb) = m ×N ×Boi

Current gas cap volume (rb) = m ×N ×Boi ×(Bg ÷ Bgi)

Gas cap expansion (rb) = Current gas cap volume – Initial gas cap volume

Gas cap expansion (rb) = m ×N ×Boi ×[(Bg ÷ Bgi)-1]

Expansion Term

Oil expansion term (Eo)

Eo = (Bo – Boi) + (Rsi – Rs) ×Bg

 Rock and connate water expansion term (Ef,w)

efw

Gas cap expansion term (Eg)

Eg = Boi ×[(Bg ÷ Bgi)-1]

With all expansion terms, total expansion can be mathematically expressed like this:

Total expansion (rb) = N (Eo + Efw + m Eg)

Aquifer Influx and Injection

 Aquifer influx volume (rb) = We

Water injection volume (rb) = Wi×Bw

Gas injection volume (rb) = Gi×Bg

All relationships can be put in a material balance equation based on the following concept:

Figure-1---Concept-of-Material-Balance

material balance equation

The equation above is simplified by using an expansion term.

simplified-material-balance-equation-explained

The equation above can be rearranged like this:

simplified-material-balance-equation-REARRANGE

Simplify a term like this:

simplified-material-balance-equation-REARRANGE2

F = N×Et + We

Where;

F = Net fluid production (Volume Produced – Volume Injection)

N = Oil in place

Et = Total expansion term (oil, water, gas cap and rock)

We = water influx

This simplified equation was presented by Havlena + Odeh (1963). With this equation form, graphical plots can be easily made and material balance evaluation is donemore easily and accurately.

#1 form:

Havlen Odeh 1

The graphic can be drawn based on #1 form. The line should be a horizontal line and an intersection at y-axis is N (oil in place). Deviation from the horizontal line indicates adding or losing enery (Figure 2).

Figure-2-–-Graphic-of-Simplified-Material-Balance-Form#1

Figure 2 – Graphic of Simplified Material Balance Form#1

#2 form:

This is the form of a simplified material balance equation.

Havlen Odeh 2

A slope of the curve is 1 and the intersection on the y-axis is N. Deviation from the straight line indicates extra energy in or energy out (Figure 3).

Figure 3 - Graphic of Simplified Material Balance Form#2

Figure 3 – Graphic of Simplified Material Balance Form#2

Nomenclatures

N = oil initially in place (STOIIP) in reservoir (stb)

Np = cumulative oil production (stb)

Boi = oil volume factor at initial reservoir pressure (rb/stb)

Bo = oil volume factor at current reservoir pressure (rb/stb)

Rsi = solution GOR at initial reservoir pressure (scf/stb)

Rs = solution GOR at current reservoir pressure (scf/stb)

Rp = cumulative produced gas oil ratio (scf/stb)

G = gas volume initially in place (GIIP) in reservoir (scf)

m = ratio of initial gas cap volume to initial oil volume (rb/rb)

Bgi = gas volume factor at initial reservoir pressure (rb/scf)

Bg = gas volume factor at current reservoir pressure (rb/scf)

Swc = connate water saturation (fraction or %)

Cw = water compressibility (1/psi)

Cf = formation (rock) compressibility (1/psi)

Wp = cumulative water production (stb)

We= cumulative water influx from aquifer (rb)

Bw = water volume factor at initial reservoir pressure (rb/stb)

Wi = cumulative water injection (stb)

Gi = cumulative gas injection (scf)

Gp = cumulative gas production (scf)

Eg = gas expansion term (rb/stb)

Eo = oil expansion term (rb/stb)

Efw = formation and connate water expansion term (rb/stb)

References

Abhijit Y. Dandekar, 2013. Petroleum Reservoir Rock and Fluid Properties, Second Edition. 2 Edition. CRC Press.

L.P. Dake, 1983. Fundamentals of Reservoir Engineering, Volume 8 (Developments in Petroleum Science). New impression Edition. Elsevier Science.

Tarek Ahmed PhD PE, 2011. Advanced Reservoir Management and Engineering, Second Edition. 2 Edition. Gulf Professional Publishing.

Viewing all 497 articles
Browse latest View live


<script src="https://jsc.adskeeper.com/r/s/rssing.com.1596347.js" async> </script>