Quantcast
Channel: Drilling Formulas and Drilling Calculations
Viewing all 497 articles
Browse latest View live

Solution Gas Drive Mechanism Explained in Material Balance Equation

$
0
0

Material balance equation can be applied for any drive mechanism and this article demonstrates how to apply the material balance equation in a solution drive mechanism. For a solution drive mechanism, there are 2 cases. The first case is when reservoir pressure is above a bubble point and the second case is when reservoir pressure is below a bubble point.

Solution Gas above Bubble Point

Start with a full material balance equation.

Figure 1 - Full Material Balance Equation

Figure 1 – Full Material Balance Equation

Assumptions

  • No water production
  • No water injection
  • No gas injection
  • No gas cap
  • No water influx

Fact

Rs = Rsi

Cancel out parameters to match with solution gas assumptions.

Figure 2 - Cancel out some parameters

Figure 2 – Cancel out some parameters

The material balance will be like this:

material balance after cacel out

Oil Compressibility is the equation below;

Co = (Bo – Boi) ÷ (Boi ×ΔP)

material balance after cacel out 2

Solution Gas below Bubble Point

Assumptions

  • No water production
  • No water injection
  • No gas injection
  • No gas cap
  • No water influx

Cancel out parameters to match with solution gas assumptions.

Figure-3---Cancel-some-parameters

Figure 3 – Cancel some parameters


The material balance will be like this:

material balance after cacel out 3 below bp

The equation can be simplified (Havlena + Odeh (1963)) in this form.

F = N (Eo + Efw)

Where;

F= Net fluid production

N = Oil in place

Eo Efw

For this form, a graphical method can be used to verify oil in place (N) as shown in Figure 4.

Figure 4 - Graphical plot for a solution gas drive

Figure 4 – Graphical plot for a solution gas drive

If the plot shows a straight line, the slope is oil in place (N). However, if the slope is not a straight line, it indicates that oil in place is either too big or too small.

Nomenclatures

N = oil initially in place (STOIIP) in reservoir (stb)

Np = cumulative oil production (stb)

Boi = oil volume factor at initial reservoir pressure (rb/stb)

Bo = oil volume factor at current reservoir pressure (rb/stb)

Rsi = solution GOR at initial reservoir pressure (scf/stb)

Rs = solution GOR at current reservoir pressure (scf/stb)

Rp = cumulative produced gas oil ratio (scf/stb)

G = gas volume initially in place (GIIP) in reservoir (scf)

m = ratio of initial gas cap volume to initial oil volume (rb/rb)

Bgi = gas volume factor at initial reservoir pressure (rb/scf)

Bg = gas volume factor at current reservoir pressure (rb/scf)

Swc = connate water saturation (fraction or %)

Cw = water compressibility (1/psi)

Cf = formation (rock) compressibility (1/psi)

Wp = cumulative water production (stb)

We= cumulative water influx from aquifer (rb)

Bw = water volume factor at initial reservoir pressure (rb/stb)

Wi = cumulative water injection (stb)

Gi = cumulative gas injection (scf)

Gp = cumulative gas production (scf)

Eg = gas expansion term (rb/stb)

Eo = oil expansion term (rb/stb)

Efw = formation and connate water expansion term (rb/stb)

References

Abhijit Y. Dandekar, 2013. Petroleum Reservoir Rock and Fluid Properties, Second Edition. 2 Edition. CRC Press.

L.P. Dake, 1983. Fundamentals of Reservoir Engineering, Volume 8 (Developments in Petroleum Science). New impression Edition. Elsevier Science.

Tarek Ahmed PhD PE, 2011. Advanced Reservoir Management and Engineering, Second Edition. 2 Edition. Gulf Professional Publishing.


Common Crude Oil Properties in Petroleum Industry (Video Training)

$
0
0

Crude oil properties are important for us to understand what they mean and how they will affect us. The most commonly measured properties of crude oil are specific gravity or API gravity, viscosity, color, and odor.

This video training will teach you all basic information about crude oil properties so you will know and be able to quickly differentiate crude oil. Addtionally, we also provide you full video transcript which may help someone to effectively learn from this training material.

Full VDO Transcript

properties-of-crude-oil-cover-no-text

Let’s look at the most commonly measured properties of crude oil: specific gravity or API gravity, viscosity, color, and odor. In the marketplace, crudes are classified by density and sulfur content. Density is measured in degrees API. Light crudes typically are easier to process than are heavy crudes. Sulfur content is measured as a percentage. Crudes with less than .7% sulfur content are considered sweet crudes. Crudes with greater than .7% sulfur content are considered sour crudes. Acid content is measured by total asset number, TAN. Crudes with a TAN greater than .7 are highly corrosive to refinery equipment.

What is density? Density is the weight divided by volume. Specific gravity is a dimensionless number, which is a measure of the density of a substance compared to the density of pure water at an arbitrary temperature and pressure. As such, we measure the weight of water versus the weight of crude oil. Measurement of density is defined by the American Petroleum Institute. API fixes the specific gravity of water at 1 g/cm³. According to the API gravity scale, specific gravity equals 141.5 divided by 131.5 plus degrees API. Specific gravity can be measured with a hydrometer. API gravity is equal to 141.5 divided by specific gravity at standard temperature and standard pressure, minus 131.5. We can also measure API gravity with a hydrometer. In fact, lease operators typically every morning measure the API gravity of the oil that’s being produced from a well.

The specific gravity of water is equal to 1; thus, because oil is lighter than water, the specific gravity of oil is usually less than 1. The API gravity of water is 10; thus, because oil is lighter than water, the API gravity of oil is greater than 10. Crude oil can be described as light, which is greater than 31.1° API; medium, which is between 22.3° API and 31.1° API; heavy crude oils, which are less than 22.3° API and extra heavy crude oils, which are less than 10° API.

Viscosity is a word used to define a fluid’s resistance to flow. For example, water has a higher rate of flow than the rate of flow of honey. This is a picture of motor oils of different viscosities. The viscosity of crude oil varies from field to field. For crude oils of like chemical composition, viscosity increases with decreases in API gravity. Temperature also affects viscosity. The higher the temperature, the lower the viscosity. Dissolved gas can affect viscosity. The effect of solution gas is to reduce viscosity. Pressure has an effect on viscosity. For most liquids, viscosity increases with increasing pressure, because the amount of free volume in the internal structure decreases due to compression. Consequently, the molecules can move less freely and the internal friction forces increase. The result is increased flow resistance. Above saturation pressure viscosity increases almost linearly with pressure.

Material Balance for Gas Cap Drive Mechanism

$
0
0

This article will demonstrate a material balance equation in gas cap drive mechanism.  First, we start with a full material balance equation.

Figure 1 - Full Material Balance Equation

Figure 1 – Full Material Balance Equation

Assumptions

  • No water production
  • No water injection
  • No gas injection
  • No water influx
  • Neglect formation and connate water compressibility (Cf and Cw have little effect for a gas cap drive mechanism.)

Figure 2 - Material Balance Equation with Assumption for a Gas Cap Drive Mechanism

Figure 2 – Material Balance Equation with Assumption for a Gas Cap Drive Mechanism

The material balance shown in Figure 2 can be simplified like this:

simplifield equation for gas cap

For a gas cap drive, oil and gas production is equal to oil + dissolved gas expansion pus gas cap expansion.

This can be described in a simple equation (Havlena + Odeh (1963)) like this:

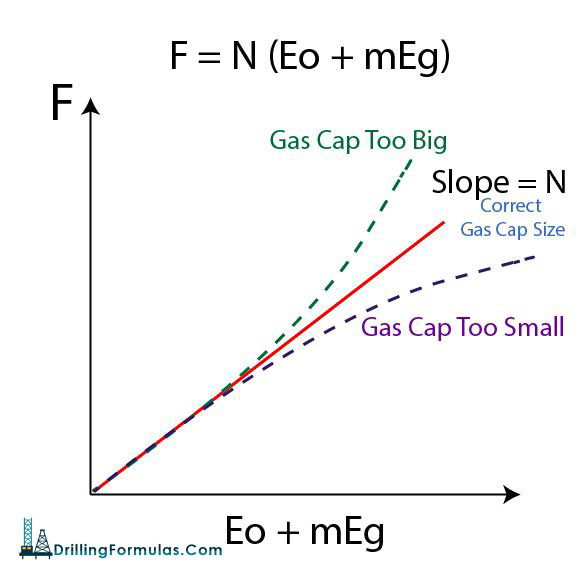
F = N (Eo + m Eg)

Where;

F = Net fluid production

N = Oil in place

Eo = oil expansion term

m = initial gas cap volume / initial oil volume (rb/rb)

Eg = gas expansion term

The plot is constructed between F and (Eo+mEg).

Figure 3 – Graphic Solution for Gas Cap Drive Mechanism

Figure 3 – Graphic Solution for Gas Cap Drive Mechanism

If a plot shows a straight line slope, it means that gas cap volume is correct. Any deviation from a straight line indicates either a too small or too big gas cap size as shown in Figure 3.

Nomenclatures

N = oil initially in place (STOIIP) in reservoir (stb)

Np = cumulative oil production (stb)

Boi = oil volume factor at initial reservoir pressure (rb/stb)

Bo = oil volume factor at current reservoir pressure (rb/stb)

Rsi = solution GOR at initial reservoir pressure (scf/stb)

Rs = solution GOR at current reservoir pressure (scf/stb)

Rp = cumulative produced gas oil ratio (scf/stb)

G = gas volume initially in place (GIIP) in reservoir (scf)

m = ratio of initial gas cap volume to initial oil volume (rb/rb)

Bgi = gas volume factor at initial reservoir pressure (rb/scf)

Bg = gas volume factor at current reservoir pressure (rb/scf)

Swc = connate water saturation (fraction or %)

Cw = water compressibility (1/psi)

Cf = formation (rock) compressibility (1/psi)

Wp = cumulative water production (stb)

We= cumulative water influx from aquifer (rb)

Bw = water volume factor at initial reservoir pressure (rb/stb)

Wi = cumulative water injection (stb)

Gi = cumulative gas injection (scf)

Gp = cumulative gas production (scf)

Eg = gas expansion term (rb/stb)

Eo = oil expansion term (rb/stb)

Efw = formation and connate water expansion term (rb/stb)

References

Abhijit Y. Dandekar, 2013. Petroleum Reservoir Rock and Fluid Properties, Second Edition. 2 Edition. CRC Press.

L.P. Dake, 1983. Fundamentals of Reservoir Engineering, Volume 8 (Developments in Petroleum Science). New impression Edition. Elsevier Science.

Tarek Ahmed PhD PE, 2011. Advanced Reservoir Management and Engineering, Second Edition. 2 Edition. Gulf Professional Publishing.


Material Balance for a Water Drive Mechanism

$
0
0

This article will demonstrate a material balance equation in a natural water drive mechanism.  A full material balance equation is shown below:

Figure 1 - Full Material Balance Equation

Figure 1 – Full Material Balance Equation

Assumptions

  • Reservoir pressure above the bubble point (Pb). Above a bubble point, Rs = Rsi.
  • No water injection
  • No gas injection
  • No gas cap
  • Neglect formation and connate water compressibility (Cf and Cw have little effect for a gas cap drive mechanism.)
Figure 2 - Material Balance Equation with Assumption for a Natural Water Drive Mechanism

Figure 2 – Material Balance Equation with Assumption for a Natural Water Drive Mechanism

The material balance shown in Figure 2 can be simplified like this:

This can be described in a simple equation (Havlena + Odeh (1963)) like this:

F = N Eo + We

F/Eo = N + We/Eo

Where;

F = Net fluid production

N = Oil in place

Eo = oil expansion term

We = water influx

The plot is constructed between F/Eo and (We/Eo).

Figure-3---Graphic-Solution-for-Natural-Water-Drive-Mechanism

Figure 3 – Graphic Solution for Natural Water Drive Mechanism

The interception point on Y-Axis is oil in place (N). If the plot is not a straight line, it indicates that the size of the aquifer is either too small or too big (Figure 3).

Nomenclatures

N = oil initially in place (STOIIP) in reservoir (stb)

Np = cumulative oil production (stb)

Boi = oil volume factor at initial reservoir pressure (rb/stb)

Bo = oil volume factor at current reservoir pressure (rb/stb)

Rsi = solution GOR at initial reservoir pressure (scf/stb)

Rs = solution GOR at current reservoir pressure (scf/stb)

Rp = cumulative produced gas oil ratio (scf/stb)

G = gas volume initially in place (GIIP) in reservoir (scf)

m = ratio of initial gas cap volume to initial oil volume (rb/rb)

Bgi = gas volume factor at initial reservoir pressure (rb/scf)

Bg = gas volume factor at current reservoir pressure (rb/scf)

Swc = connate water saturation (fraction or %)

Cw = water compressibility (1/psi)

Cf = formation (rock) compressibility (1/psi)

Wp = cumulative water production (stb)

We= cumulative water influx from aquifer (rb)

Bw = water volume factor at initial reservoir pressure (rb/stb)

Wi = cumulative water injection (stb)

Gi = cumulative gas injection (scf)

Gp = cumulative gas production (scf)

Eg = gas expansion term (rb/stb)

Eo = oil expansion term (rb/stb)

Efw = formation and connate water expansion term (rb/stb)

References

Abhijit Y. Dandekar, 2013. Petroleum Reservoir Rock and Fluid Properties, Second Edition. 2 Edition. CRC Press.

L.P. Dake, 1983. Fundamentals of Reservoir Engineering, Volume 8 (Developments in Petroleum Science). New impression Edition. Elsevier Science.

Tarek Ahmed PhD PE, 2011. Advanced Reservoir Management and Engineering, Second Edition. 2 Edition. Gulf Professional Publishing.


Material Balance for Gas Reservoir

$
0
0

For gas reservoirs, the material balance concept can be applied to determine gas in place and expected gas reservoir reserve.

Gas Production = Expansion of Free Gas In Reservoir

equation 1 Gp

Assumption:

  • Dry gas reservoir
  • No external energy support like water drive.

Where;

Gp = gas production (std cu-ft)

Bg = gas formation volume factor (res cu-ft/std cu-ft)

G = gas in place (std cu-ft)

Bgi = initial formation volume factor (res cu-ft/std cu-ft)

Gas formation volume factor (Bg)

equation2 bg

Where;

Ps = pressure at standard condition (14.7 psia)

P = pressure at a certain condition, R

z = compressibility factor at a certain condition

T = temperature at a certain condition, R

T= standard temperature, 520 R (60F)

With Bg, the first equation can be written like this

equation 3

Rearrange the equation like this:

equation 4

The rearranged equation can be plotted between P/z and Gp (Figure 1).

equation 5

Figure 1 - P/z plot

Figure 1 – P/z plot

Figure 1 is called” P/z” plot and the interception at x-axis is gas in place (G).

Note: The P/z plot is valid for dry gas reservoir. If a reservoir has pressure support from an aquifer, the p/z plot will give an overestimated gas in place (Figure 2).

Figure 2 - Over estimated gas in place

Figure 2 – Over estimated gas in place

P/z plot is a good tool, but if you use the plot with few data points, it will give you a big error on gas in place (G) and reserves.

References

Abhijit Y. Dandekar, 2013. Petroleum Reservoir Rock and Fluid Properties, Second Edition. 2 Edition. CRC Press.

L.P. Dake, 1983. Fundamentals of Reservoir Engineering, Volume 8 (Developments in Petroleum Science). New impression Edition. Elsevier Science.

Tarek Ahmed PhD PE, 2011. Advanced Reservoir Management and Engineering, Second Edition. 2 Edition. Gulf Professional Publishing.

Determine Quantity of Material Used in Mixing a Simple Drilling Mud

$
0
0

This is a simple example to demonstrate how to determine quantity of material required in a simple mixing system. Let’s learn from the example below.

The objective is to build mud which has a weight of 11.0 ppg with 1,000 bbl.

The mud recipe is shown below;

  • 30 ppb bentonite
  • 5 ppb CMC polymer
  • 5 ppb caustic soda (NaOH)
  • 25 ppb Na2CO3
  • Weighting Material is barite.

The following are important data of water and chemical used for this calculation.

Base fluid = fresh water

Specific gravity of water = 1

Specific gravity of barite = 4.2

Specific gravity of bentonite = 2.4

Specific gravity of CMC polymer = 2.4

Fresh water weight = 8.34 ppg

NaOH and Na3CO3 have negligible volume because it is dissolvable.

What is quantity of material required to meet the mud specification?

What is the final volume?

Weight of chemical (ppb) is based on the volume of drilling mud.

Weight of chemical required as per a mud formula.

Bentonite (30 ppb) = 30 × 1,000= 30,000 lb.

CMC polymer (0.5 ppb) = 0.5 × 1,000 =500 lb.

NaOH (0.5 ppb) = 0.5 × 1,000 =500 lb.

Na2CO3 (0.25 ppb) = 0.25 × 1,000 =250 lb.

Density of material is listed below;

Water = 8.34 ppg.

Barite = 4.2 × 8.34 = 35.0 ppg.

Bentonite = 2.4 × 8.34 = 20.0 ppg.

CMC polymer = 2.4 × 8.34 = 20.0 ppg.

Volume of water in gallon = X gallons

Weight of water (lb.) = volume (gallon) × density of water (ppg)

Weight of water (lb.) = X × 8.34

Volume of barite = Y gallons

Weight of barite (lb.) = volume (gallon) x density of barite (ppg.)

Weight of water (lb.) = Y × 35

Construct the table like this and fill in some data.

Table 1

Volume of bentonite (A) = Weight of bentonite ÷ density of bentonite

Volume of bentonite (A) = 30,000 ÷ 20 = 1,500 gallon

Volume of CMC Polymer (B) = Weight of CMC Polymer ÷ density of CMC Polymer

Volume of CMC Polymer (B) = 500 ÷ 20 = 25 gallon

Volume of NaOH and Na3CO3 will not be considered as they dissolve and have very little effect on volume. They will contribute to the weight of fluid.

The table will be like this.

Table 2

The planed mud weight is 10 ppg, so we can write the relationship like this:

Total Weight (lb.) ÷ Total Volume (gallon) = 10 (ppg)

Total Weight (lb) = 8.34X + 30,000+500+500+250+ 35Y

Total Weight (lb) = 31,250 + 8.34X + 35Y

Total Volume (gallon) = 1,500 + 25 + X + Y

Total Volume (gallon) = 1,525 + X + Y

Therefore;

(31,250 + 8.34X + 35Y) ÷ (1,525 + X + Y) = 10 — Equation 1

Total Volume required = 1,000 bbl = 1,000 × 42 = 42,000 gallon

Note: 1 bbl = 42 US gallon.

Therefore;

42,000 = 1,525 + X + Y — Equation 2

From Equation 2,

X = 40,475 – Y — Equation 3

Substitute from Equation 3 in Equation 1

(31,250 + 8.34X + 35Y) ÷ (1,525 + X + Y) = 10

(31,250 + 8.34X + 35Y) = 10 × (1,525 + X + Y)

(31,250 + 8.34×(40,475 – Y)+ 35Y) = 10 × (1,525 + 40,475 – Y + Y)

Solve Y

Y = 1,920

Substitute Y in Equation 3 to solve X

X = 38,555

The final table is shown below.

Table 3

Summary

In order to build simple water based mud system as per the mud plan, the list of material weight required is shown below;

  • Drill water = 321,550 lb. (38,555 gallon)
  • Bentonite = 30,000 lb.
  • CMC polymer = 500 lb.
  • NaOH = 500 lb.
  • Na2CO3 = 250 lb.
  • Barite = 67,200 lb.

References

Andy Philips, 2012. So You Want to be a Mud Engineer: An Introduction to Drilling Fluids Technology. Edition. CreateSpace Independent Publishing Platform.

Ryen Caenn, 2011. Composition and Properties of Drilling and Completion Fluids, Sixth Edition. 6 Edition. Gulf Professional Publishing.

Volumetric Method To Estimate Volume In Place and Reserves

$
0
0

Volumetric is a method to estimate fluid in reservoir based on volume of pore space in a rock and water saturation.

Volume of Oil Initially In Place (OIIP)

To estimate oil initially volume in place, the following formula is a volumetric calculation for oil.

STOIIP

Where;

STOIIP = stock tank oil in place, stb

A= area, acre

h = reservoir thickness, ft

ɸ = rock porosity, %

Swc =connate water saturation, %

Boi = oil formation volume factor, rb/stb

Note: the stock tank condition is a standard surface condition of oil and gas at 60F and 14.7 psia.

Volume of Gas Initially In Place (GIIP)

The formula to determine gas in place is listed below;

G

Where;

G = gas oil in place at standard condition, scf

A= area, acre

h = reservoir thickness, ft

ɸ = rock porosity, %

Swc =connate water saturation, %

Bgi =  gas formation volume factor, rcf/scf

Note: This is the same formula as the oil in place but only constant is different because of volume of gas is reported in cu-ft.

Example Calculations

Oil reservoir

Area = 10,000 acre

Thickness (H) = 100 ft

Average porosity (ɸ) = 20%

Connate Water Saturation (Swc) = 25%

Oil formation volume factor (Bo) = 1.29 rb/stb

STOIIP example

STOIIP = 902.1 MM STB

Reserves

In reservoir engineering, volume of hydrocarbon in a reservoir called volume in place (oil and/or gas). Volume of hydrocarbon that can be commercially recovered is called “Reserves”. Reserves shall satisfy four criteria which are discovered, recoverable, commercial and remaining based on the development method. Each company may rate the reserves differently based on several criteria.

If you are interested in how to classify reserves, this is a recommended document provided by Social of Petroleum Engineering (SPE) – Petroleum Resources Management System, Society of Petroleum Engineers et al, 2007.

http://www.spe.org/industry/docs/Petroleum_Resources_Management_System_2007.pdf

References

Abhijit Y. Dandekar, 2013. Petroleum Reservoir Rock and Fluid Properties, Second Edition. 2 Edition. CRC Press.

L.P. Dake, 1983. Fundamentals of Reservoir Engineering, Volume 8 (Developments in Petroleum Science). New impression Edition. Elsevier Science.

Tarek Ahmed PhD PE, 2011. Advanced Reservoir Management and Engineering, Second Edition. 2 Edition. Gulf Professional Publishing.

API and HTHP Fluid Loss

$
0
0

Fluid loss is one of important drilling fluid properties and two type of fluid loss are API and HTHP fluid loss. This article will explain about both of them and effect on the drilling operation.

API Fluid Loss Test

API Fluid Loss Test (low-pressure, low-temperature filtration test) is a test used to measure a filtration of mud with ambient temperature and 100 psi differential pressure. The API fluid loss testing equipment is shown below (Figure 1).

Figure 1 - API Fluid Loss Test Kit

Figure 1 – API Fluid Loss Test Kit

How will the drilling mud be tested?

  • Place a filter
  • Add the sample into the testing chamber
  • Place the chamber in the testing kit
  • Apply 100 psi pressure
  • Record volume for 30 minutes; at the end of the test the volume of filtrate will be recorded.
  • Record thickness of filter cake

If drilling fluid has good fluid loss property, it will show a thin and impermeable mud cake. Please keep in mind that this test is based on the surface condition, and it may be in error because it does not simulate downhole conditions. The API fluid loss test can lead you to the wrong conclusion, because at the surface condition the test demonstrates very good fluid loss and a very thin filter cake.When the drilling mud is in a downhole condition, wellbore temperature and pressure can dramatically change drilling fluid properties.The best way to test the fluid loss is to simulate wellbore condition at high pressure high temperature in order to see what the fluid loss property will be. The procedure is called” HTHP Fluid Loss.”

 HTHP Fluid Loss Test

The HTHP fluid loss test is similar to the API test because it indicates information on drilling mud filtration into the formation under a static condition over a certain period of time.

Figure 2 - HTHP fluid loss test kit

Figure 2 – HTHP fluid loss test kit

For the HTHP fluid test, both temperature and pressure can be varied to represent an expected downhole condition. The HTHP testing equipment has a heating jacket so you can heat up the drilling fluid sample to the expected wellbore temperature. Typically, the recommended temperature in the heating jacket should be above the estimated temperate of about 25 F to 50 F. The test pressure is normally at 500 psi differential pressure.  Normal test conditions are 150 F and 500 psi differential pressure and the maximum allowable test temperature is 300 F with the standard equipment. Mud filter cake thickness must be maintained below 2 mm. The HTHP test is performed for 30 minutes, just like the API fluid lost test.

The video below shows how to do a HTHP fluid loss test. Even though it does not describe anything, it still gives you some ideas on how to do it.

Drilling Operational Impacts of Fluid Loss

 The impacts of fluid loss on a drilling operation are listed below;

Formation damage

If the drilling mud does not have good fluid loss property, fluid with small particles in the drilling mud can be invaded into formations and it will cause formation damage. This will directly affect the production rate of the well once it starts producing.

Differential sticking

The drilling fluid that has bad fluid loss will form a very soft and thick mud cake across permeable formations. This can lead to differential sticking because of an increase in the contact area between formation and drill string.

Torque and drag

A thick mud cake across porous zones can be easily formed because the drilling mud has high fluid loss values. The thicker the  mud cake is, the more torque and drag are experienced while performing the drilling and tripping operations.

References

Andy Philips, 2012. So You Want to be a Mud Engineer: An Introduction to Drilling Fluids Technology. Edition. CreateSpace Independent Publishing Platform.

Ryen Caenn, 2011. Composition and Properties of Drilling and Completion Fluids, Sixth Edition. 6 Edition. Gulf Professional Publishing.


Mud Filter Cake

$
0
0

Mud filter cake is a layer formed by solid particles in drilling mud against porous zones due to differential pressure between hydrostatic pressure and formation pressure.  For the drilling operation, it is preferred to have a filter cake that is impermeable and thin. Practically, the filter cake should be less than or equal to 1/16 inch. If drilling fluid is not in a good shape, which results in a thick filter cake in the wellbore, it will lead to a stuck pipe situation and high torque/drag.

Mud filter cake

Mud filter cake

Credit: http://gwri.calpoly.edu/media/projects_reuse_waste/corrugated/reuse_corrugated_filtercake.jpg

How will the filter cake impact on a drilling operation?

Differential sticking

If mud filter cake is thick, a contact area between drilling string or any kind of tubular will be increased. When drilling into permeable zones that are severely overbalanced, the drill stem will have high chance to get differentially stuck across them.  Moreover, not only can the drilling string get stuck, the logging tool may be differentially stuck across the permeable zones as well.

Torque and drag

Under dynamic conditions such as drilling, working pipe, etc., if drilling mud has a thick filter cake across the wall of the wellbore, torque will increase.  Furthermore, a thick wall filter cake will result in high drag while tripping out of the hole or logging.

References

Andy Philips, 2012. So You Want to be a Mud Engineer: An Introduction to Drilling Fluids Technology. Edition. CreateSpace Independent Publishing Platform.

Ryen Caenn, 2011. Composition and Properties of Drilling and Completion Fluids, Sixth Edition. 6 Edition. Gulf Professional Publishing.

Determine Compressibility of Gases

$
0
0

This article will demonstrate how to determine gas compressibility by using simplified equation of state.

At a low pressure condition, gas similarly behaves like ideal gas and the equation for the ideal gas law is listed below;

PV = nRT

Where;

P = pressure

V = gas volume

T = absolute temperature

n = number of moles of gas

R = gas constant

Gas constant (R) is different because it depends on the unit system used in the calculation. The R in the different unit system is demonstrated in the below table.

1 table for R

Table 1 – Gas Constant (R) at Different Unit

At normal pressure and temperature, the ideal gas law is accurate to determines gas behavior. However, the ideal gas law cannot be applied to gas in a reservoir as pressure and temperature in a reservoir is much higher than atmospheric conditions. Therefore, the real gas equation has a compressibility factor(z) to correct the real gas relationship. The real gas relationship can be shown below;

PV = znRT

Where;

P = pressure

V = gas volume

T = absolute temperature

n = number of moles of gas

R = gas constant

z = compressibility factor

z=1.0 means the ideal gas.

The compressibility factor (z) is changed by temperature and pressure. The two charts in Figure 1 demonstrate how z-factor changes with temperature and pressure.

Figure 1- Compressibility factor at different pressure and temperature

Figure 1– Compressibility factor at different pressure and temperature

At a reservoir condition, gas is mixtures of several gas molecules therefore it is impossible to have the z-factor chart made to match with each composition of gas in a reservoir. Therefore, the Principle of Corresponding States by Van der Waals (in 1873) is utilized to describe gas in reservoir conditions. The concept of the Principle of Corresponding States proposes that the equation state shown in reduced gas properties is the same for all gas types and mixtures.

The reduce properties are shown below;

PR (reduced pressure) = P ÷ Pc

VR (reduced volume) = V ÷ Vc

TR (reduced temperature) = T ÷ Tc

Where;

P = current pressure

Pc= critical pressure

V = current volume

Vc = critical volume

T = current temperature

Tc = critical temperature

Note: the critical point is where the liquid and the vapor have the same properties.


Critical Pressure and Temperature Gas in Imperial Unit is shown in Figure 2.

Figure 2 - Critical Pressure and Temperature of Gas in Imperial Unit

Table 2 – Critical Pressure and Temperature of Gas in Imperial Unit

Critical Pressure and Temperature Gas in SI Unit is shown in Table 3.

Table 3 - Critical Pressure and Temperature of Gas in SI Unit

Table 3 – Critical Pressure and Temperature of Gas in SI Unit

How To Determine z-Factor of Mixtures of Gas

The Standing and Katz (1941) chart is widely used to estimate reservoir gas compressibility factor (z). The z-factor chart is shown below. The x-axis is pseudo reduced pressure and  each line represents pseudo reduce temperature. The y-axis is the compressibility factor (z).

Figure 2 - The Standing and Katz (1941) chart

Figure 2 – The Standing and Katz (1941) chart

The pseudo-reduced properties are used in order to deal with all components of gas and the relationships are expressed below;

PR’ (pseudo reduced pressure) = P ÷ Pc’

TR’ (pseudo reduced temperature) = T ÷ Tc’

Where;

PR’ = pseudo-reduced pressure

TR’ = pseudo-reduced temperature

P = current pressure

Pc’= pseudo-critical pressure

T = current temperature

Tc’ = pseudo-critical temperature

Pseudo-critical Temperature and Pressure can be calculated by a summation of weighted average of critical temperature and pressure of each component (Kay’s Rules).

Pc’ = y1Pc1 + y2Pc2 + y3Pc3 + y4Pc4 +…

Tc’ = y1Tc1 + y2Tc2 + y3Tc3 + y4PTc4 +…

Steps to Determine z-Factor Based on Pseudo-Properties

  1. Determine pseudo-critical pressure (Pc’ ) and temperature (Tc’)
  2. Determine pseudo-reduce pressure (PR’) and temperature (TR’)
  3. Utilize the Standing and Katz (1941) chart (Figure 2) to get the value of z-factor from the chart.

Correction for Acid Gases

If acid gases as carbon dioxide and/or hydrogen sulphide are more than 5% by volume, the correction must be applied. The Wichert and Aziz correction is used to correct the effect of acid gas contents.

The correction factor (ɛ) that is used to correct the pseudo-critical temperature and pressure is given by:

correction factor

Where

A =sum of mole fractions of carbon dioxide (CO2) and hydrogen sulphide (H2S) in the mixture

B = mole fraction of hydrogen sulphide (H2S) in the mixture.

Once the correction factor (ɛ) is determined, the corrected pseudo-critical temperature and pressure can be calculated by the following equations.

Corrected pseudo-critical temperature (Tc”)

Corrected pseudo-critical temperature

Corrected pseudo-critical pressure (Pc”)

Corrected pseudo-critical pressure

Where;

Pc’= pseudo-critical pressure

Tc’ = pseudo-critical temperature

After calculating the corrected pseudo-critical temperature (Tc”) and corrected pseudo-critical pressure (Pc”), use these figures to calculate the corrected pseudo-reduced pressure and temperature. Then use the Standing and Katz chart to obtain a compressibility factor (z) in a normal way.

References

Abhijit Y. Dandekar, 2013. Petroleum Reservoir Rock and Fluid Properties, Second Edition. 2 Edition. CRC Press.

L.P. Dake, 1983. Fundamentals of Reservoir Engineering, Volume 8 (Developments in Petroleum Science). New impression Edition. Elsevier Science.

Tarek Ahmed PhD PE, 2011. Advanced Reservoir Management and Engineering, Second Edition. 2 Edition. Gulf Professional Publishing.

Example of Real Gas Calculation

$
0
0

This example will demonstrate how to calculate the compressibility of real gas in order to determine gas density and specific gravity at a specific condition.

Calculate the following based on the given condition:

1) Density of this gas under the reservoir conditions of 7,500psia and 220ºF,

2) Specific gravity of the gas.

Gas component is shown in Table 1

Table 1 - Gas Component

Table 1 – Gas Component

Average density of air = 28.96 lb/cu-ft

Solution

  • Determine critical pressure and temperature of gas mixtures using Kay’s rule
Table 2 - Critical Pressure and Temperature

Table 2 – Critical Pressure and Temperature

Note: critical pressure and temperature can be found from this link – http://www.drillingformulas.com/determine-compressibility-of-gases/

Pc’ = Σyipci = 660.5 psia

Tc’ = ΣyiTci = -46.2 F = -46.2 +460 F = 413.8 R

Table 3 - Pc' and Tr' by Kay's Rule

Table 3 – Pc’ and Tr’ by Kay’s Rule

  • Calculate Tr and Pr

Tr = T ÷Tc

Tr = (220+460) ÷ (-46.2+460)

Tr = 1.64

Note: temperature must be in Rankin.

Pr = P ÷ Pc

Pr = 7500 ÷ 660.5 = 11.4

  • Read the compressibility factor (z) from the chart.

z = 1.22

Figure 1-z-factor from the Standing and Katz Chart

Figure 1-z-factor from the Standing and Katz Chart

  • Calculate average molar mass

Average Molar Mass = Σyi×Mi = 22.1 lb

Table 4 - Average Molar Mass of Gas

Table 4 – Average Molar Mass of Gas

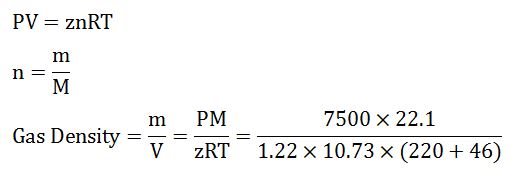
  • Calculate density of gas from the equation below;

gas density

Gas Density = 18.6 lb/cu-ft

  • Calculate gas specific gravity from the equation below;

SG = Gas Density ÷ Air Density

SG = 18.6 ÷ 28.96

SG = 0.64

Summary:

The answers for this answer are listed below;

Gas Density = 18.6 lb/cu-ft

SG = 0.64

We wish that this example will help you understand to determine z-factor and use it to calculate any related information.

References

Abhijit Y. Dandekar, 2013. Petroleum Reservoir Rock and Fluid Properties, Second Edition. 2 Edition. CRC Press.

L.P. Dake, 1983. Fundamentals of Reservoir Engineering, Volume 8 (Developments in Petroleum Science). New impression Edition. Elsevier Science.

Tarek Ahmed PhD PE, 2011. Advanced Reservoir Management and Engineering, Second Edition. 2 Edition. Gulf Professional Publishing.

Solid Content in Drill Mud

$
0
0

Solid content is a fraction of the total solid in drilling mud, and it always increases while drilling ahead because of drilling solid (cuttings), mud chemical additives and weighting material. Solid content refers to soluble and insoluble solid content in the drilling fluid system.

solid-content-in-mud

There are three types of solid contents as listed below;

Soluble material such as salt
Insoluble high gravity solid (HGS) such as weighting agents (barite, calcium carbonate, hematite, etc.)
Insoluble low gravity solid (LGS) or drilled solid such as solids particles from cuttings


The drill solids are the worst solid content in the drilling fluid because it gradually deteriorates mud properties. Moreover, if its particle size is less than 5 microns, these drill solids cannot be removed by mechanical methods, and they will stay in the mud forever. Generally, the drill solids will take up 6-7 percent of the total mud volume. Since the drilled solid content is very important, it must be checked daily.  For good drilling practices, the drilled solid should be tested twice a day by retorting.  The upper limit of the drill solid faction should be 6-7 % by volume or approximately 55 – 60 lb/bbl.

Another critical value besides low gravity solid (LGS) and high gravity solid (HGS) is the average density of weighting materials in drilling fluid. The weighting materials such as Barite, Calcium Carbonate, Hematite, etc., have a specific gravity above 2.7.  Table 1  demonstrates some important specific gravity of weighting materials.

Table 1 - Specific Gravity of Weighting Materials

Table 1 – Specific Gravity of Weighting Materials

However, the drilled solids usually have a specific gravity about 2.6. Hence, drill solids will reduce average solid density when mixed in the drilling fluid.  Normally, the acceptable value of the average solid density is about 3.8 or higher. If this value is below 3.8, it indicates that there may be too much low gravity solid in the mud.

The operational impacts of solid content

The solid content has several operational impacts on drilling operation as listed below;

Equivalent Circulating Density (ECD)

ECD will be higher if the solid content increases. Excessive ECD will lead to formation fracture and a loss circulation issue.

Differential Sticking 

The filter cake will be thick and sticky, if there are a lot of low gravity solids in the drilling mud.  Due to this reason, the potential of getting deferentially stuck across permeable formations is increased.

Rate of penetration 

High concentration of the solid content will reduce the overall rate of penetration. There are three solid contents added into the system. The first two contents are weighting material and chemicals which are needed to maintain good mud properties. The last one is the drill solid which can be controlled by mechanical methods. If the drill solid content is not controlled properly, drilling performance will decrease.

Surge/swab pressure 

The excessive surge and swab pressures result from the high amount of solid contents in the fluid system.

References

Andy Philips, 2012. So You Want to be a Mud Engineer: An Introduction to Drilling Fluids Technology. Edition. CreateSpace Independent Publishing Platform.

Ryen Caenn, 2011. Composition and Properties of Drilling and Completion Fluids, Sixth Edition. 6 Edition. Gulf Professional Publishing.

Pemex oil facility explosion in Coatzacoalcos

$
0
0

Safety is very crucial in oil and gas industry. We wish most of people would be safe and the situation would be back to normal soon.

MEXICO CITY, April 20 (Reuters) – A massive explosion rocked a major petrochemical facility of Mexican national oil company Pemex in the Gulf state of Veracruz on Wednesday (20-Apr-16), killing at least three people, injuring dozens more, and pumping a cloud of noxious chemicals into the sky. Luis Felipe Puente, head of federal emergency services, told Reuters that three people had died in the blast. Pemex confirmed that three of its workers had died, and said another 136 were injured, of which 88 were still in the hospital.


The firm said the explosion, which sent a huge, dark plume of smoke billowing upwards, occurred just after 3 p.m. (2000 GMT) at the facility’s chlorinate 3 plant near the port of Coatzacoalcos, one of the company’s top oil export hubs.Local emergency officials said hundreds of people had been evacuated from the site. Television footage showed an initial burst of flames followed by a tower of thick smoke. A company official said local oil exports were unaffected.What caused the blast was unclear, but Pemex initially warned local residents to keep away from the site due to what it described as a dissipating cloud of toxic fumes. TV footage showed rain clouds gathering above the plant as evening fell.”The current situation at the plant… is under control and there is no risk to the population,” Pemex said later in the evening on its official Twitter account.

Pemex Chief Executive Jose Antonio Gonzalez traveled to Coatzacoalcos late on Wednesday to oversee the response.
Petroquimica Mexicana de Vinilo, or PMV, a vinyl petrochemical plant that is a joint venture between Pemex’s petrochemical unit and Mexican plastic pipe maker Mexichem was the facility hit by the blast.
Operated by Mexichem, the plant lies within Pemex’s larger Pajaritos petrochemical complex. Mexichem said in a statement the explosion occurred in an ethylene unit at the plant. The company could not be immediately reached for further comment.

In February, a fire killed a worker at the PMV plant, which makes vinyl chloride monomer, also known as chloroethene, an industrial chemical used to produce plastic piping.The incident occurred just weeks after three workers were killed and seven injured when a fire broke out on a Pemex oil-processing platform in the Gulf of Mexico.

It also came as Pemex implements deep cost cuts to cope with the rout in oil prices, and seeks to stem a slide in output. Mexico is in the midst of a historic push to lure private investors to revive its oil industry.
Pemex, which enjoyed a decades-long monopoly over Mexico’s oil and gas industry until an energy reform opened up the sector in 2014, has experienced a series of high-profile accidents.

In 2013, at least 37 people were killed by a blast at its Mexico City headquarters, and 26 people died in a fire at a Pemex natural gas facility in northern Mexico in September 2012.A 2015 fire at its Abkatun Permanente platform in the oil-rich Bay of Campeche affected oil output and cost the company up to $780 million.Pemex said last year it had reduced its annual accident rate in 2014 by more than 33 percent. But a Reuters investigation found that Pemex was reducing its accident rate by including hours worked by office staff in its calculations.

Credit: http://www.dailymail.co.uk/wires/reuters/article-3550919/At-3-reported-killed-blast-Pemex-complex-Mexico.html#ixzz46QjPDx7H
https://www.facebook.com/BlogOi

pH in Drilling Mud (Water Based Mud)

$
0
0

pH is a value representing the hydrogen ion concentration in liquid and it is used to indicate acidity or alkalinity of drilling mud. The pH is presented in a numerical value (0-14), which means an inverse measurement of hydrogen concentration in the fluid.

The pH formula is listed below;

pH = -log10[H]

Where: H is the hydrogen ion concentration in mol.

According to the pH formula, the more hydrogen atoms present, the more acidity of substance is but the pH valve decreases. Generally speaking, a pH of 7 means neutral. Fluids with a pH above 7 are considered as being alkaline. On the other hand, the fluids with pH below 7 are defined as being acidic.

In the drilling mud, there are three main chemical components involved in Alkalinity of drilling fluid, which are bicarbonate ions (HCO3), hydroxyl ions (OH), and carbonate ions (CO3-2). The Alkalinity means ions that will reduce the acidity.

In order to get accurate measurements for the pH, using a pH meter instead of using a pH paper is recommended because it will give more accurate pH figures. Additionally, pH meters must be calibrated frequently.

ph meter

Figure 1  – pH meter


Figure 2 - pH paper

Figure 2 – pH paper

Cause of a decrease in pH of drilling Mud

There are many factors that can cause reduction in pH of drilling mud as listed below;

Water contamination – The water contamination or water influx will decrease pH in the drilling fluid because water is neutral.

Carbonate or Bicarbonate – With these two chemical molecules, the pH of drilling mud will be reduced.

Acid gases as Carbon dioxide (CO2) and Sulphur Dioxide (H2S) – If there are acid gases mixing in the system, the pH will decrease.  Additionally, acid gas has bad effect on mud properties. The rheology of the mud as PV, YP, and gel strength will increase, but Pm and Pf will decrease due to loss of pH.

Anhydrite – Chemical components of Anhydrite will neutralize hydrogen ions in the mud so pH of drilling mud will drop. It is important to increase mud pH while drilling Anhydrite formation.

References

Andy Philips, 2012. So You Want to be a Mud Engineer: An Introduction to Drilling Fluids Technology. Edition. CreateSpace Independent Publishing Platform.

Ryen Caenn, 2011. Composition and Properties of Drilling and Completion Fluids, Sixth Edition. 6 Edition. Gulf Professional Publishing.
Pm, Pf and Mf of Drilling Mud (Water based mud)

$
0
0

Pm, Pf and Mf are values indicating the alkalinity of drilling mud and the following is meaning of each value.

Pm

Pm stands for “phenolphthalein end point of the mud” and it indicates quantities of Potassium Hydroxide (KOH), caustic soda, cement, etc., in the water base mud.  The Pm refers to the amount of acid required to reduce the pH of mud to 8.3. The Pm test includes the effect of both dissolved and non-dissolved bases and salts in drilling fluid.  Especially in lime mud, Pm is used to determine the ratio of insoluble lime to soluble lime in the filtrate.

Pf

Pf stands for the phenolphthalein alkalinity of the mud filtrate. Pf is different from the Pm because it tests the affect of only dissolved bases and salts.  However, Pm includes the effect of both dissolved and non-dissolved bases and salts in drilling mud.

Mf

Mf stands for the methyl orange alkalinity end point of mud filtrate and the definition of the methyl orange alkalinity is the amount acid used to reduce the pH to 4.3.  According to the API test, Pm, Pf and Mf are shown in a daily mud report and all the figures are reported in cubic centimeters of 0.02N sulfuric acid per cubic centimeter of drilling fluid sample.

Pf and Mf are based on the mud filtrate tests that will help people know about ions in the drilling mud.

There are three cases regarding Pf and Mf.

First case: Pf and Mf are similar in value to each other. It indicates that the  ions (hydroxyl ions) are the main contributor to the mud alkalinity.

Second case:  If Pf is low but the Mf is high, it indicates that bicarbonate ions are in the mud.

Third case: if both figures (Pf and Mf) are high, it means that carbonate ions are in the mud system.

References

Andy Philips, 2012. So You Want to be a Mud Engineer: An Introduction to Drilling Fluids Technology. Edition. CreateSpace Independent Publishing Platform.

Ryen Caenn, 2011. Composition and Properties of Drilling and Completion Fluids, Sixth Edition. 6 Edition. Gulf Professional Publishing.


Total Hardness and Chloride Content in Water Based Mud

$
0
0

“Total Hardness” or “Water Hardness” is a measurement of calcium (Ca2+) and magnesium (Mg 2+) ions in water base mud. The total of both soluble ions of calcium (Ca2+) and magnesium (Mg 2+) is given by titration with standard Vesenate solution.

Total-Hardness-and-Cl-content-and-Methylene-Blue-Test

What will be happening if you have a lot of total hardness in your drilling mud?

  • Bad mud cake (thick and mushy)
  • High fluid loss
  • Flocculation of clay content
  • Less polymer effectiveness
  • Ineffective chemical treatment

For most of the water base mud, the acceptable value of total hardness must be below 300 mg/L. If the lime drilling mud is used, it is acceptable to have a higher valu,e but is should be kept below 400 mg/L.

Chloride Content in the water based mud

Thechloridecomesfromsaltintheformation,andchloride concentrationcan be determinedbytitrationwithasilvernitratesolution.Theamountofchloridemustbecheckedfrequently.Ifthere are any abnormal changesinthechloridecontent,itcanbe an indicationofdrillingintoasaltformationortakingwaterinfluxfromthereservoirs.

Why is it so important to maintain the amount of chloride in the drilling fluids?

Thechlorideisusedtopreventashaleswellingproblem.

How can the chloride content be maintained?

The chloride content in the drilling fluid can be maintained by adding salts such as potassium chloride (KCl) and sodium chloride (NaCl). If  potassium chloride (KCl) is used, it is imperative to have sufficient potassium ions to react with the clay content from the formation. Generally, 3 – 4% KCL is recommended for normal drilling. However, it may require increasing the concentration of KCl if you are drilling into formations which have a lot of reactive clay content.

Methylene Blue Test (MBT)

Methylene Blue Test (MBT) or Cation Exchange Capacity is used to determine the amount of reactive clay (clay-like materials) in a water base mud. A methylene blue dye (a cation dye) is utilized for this test because it powerfully magnetizes the negative ions in the clay. Typically, the test is reported in terms of the reactive clay concentration in pounds per barrel, bentonite equivalent.

Same as other mud properties, tracking the MBT and observed for trend changes are required in order to maintain good mud conditions. If an increase in MBT is observed, it indicates that the drill solid concentration in the drilling mud increases. For a good drilling operation, the MBT should be kept at 15 lb/barrel or less.

References

Andy Philips, 2012. So You Want to be a Mud Engineer: An Introduction to Drilling Fluids Technology. Edition. CreateSpace Independent Publishing Platform.

Ryen Caenn, 2011. Composition and Properties of Drilling and Completion Fluids, Sixth Edition. 6 Edition. Gulf Professional Publishing.

Offshore Crane Failure Case Study

$
0
0

Offloading equipment from a supply boat is one of the normal lifting operations for offshore rig. Therefore, it is very imperative to follow safety work practices while working with the crane. Crane operators have the responsibility to work with the crane safely. Before any lifting operation, a pre job safety meeting with all crew must be conducted and the plan must be clearly explained to the crew. A banksman will be only one dedicated people to give the signal to the crane operator. While lifting, there must be no one underneath the crane because anything can happen even though a crane is properly inspected.

This video is very good example to learn about the offshore crane failure. The operation was to lift the subsea well head off the boat to the rig. The crane operator picked up the wellhead from the boat. Unfortunately, the crane did not properly function and it resulted in failure. The crane bloom was damaged and fell into the sea. We strongly believe that nobody got hurts from this situation.

What we can learn from this crane failure incident.

crane-failuare

  • Be aware of any mechanical failure by staying away from the line of fire, dropped zone, etc.
  • Keep good work practice
  • Do not stay in an area where there is no place to run away

These are some good documents about the crane safely which you can study.

Lifting & hoisting safety recommended practice by The International Association of Oil & Gas Producers 

Offshore oil and gas safety II by OSHAcademy

Guidelines for Offshore Marine Operations by MSF

Recommended Practice for Occupational Safety for Oil and Gas Well Drilling and Servicing Operations by API

We wish that this learning will help you get more understanding about the crane hazard and we strongly believe that this can be applied in any operation.

Safety is our value.

What is Open Hole Completion?

$
0
0

Open hole completion or bare foot completion is one type of completion where the production casing is set on top of the reservoir, but the open hole section is left without cemented casing. Typically, drilling into a pay zone is drilled with non-damage drilling mud or drilling mud weighted with calcium carbonate, which can be dissolved with acid later if needed.

Open Hole Completion

Open Hole Completion

The pros and cons of this completion are as follows;

Advantageous of Open Hole Completion

  • Full exposure of reservoir zone
  • No cementing or perforating expense
  • Minimize formation damage
  • Minimize flow path restriction due to cementing and perforating
  • Minimize wellbore skin
  • Improve wellbore performance due to a large inflow area

Disadvantageous of Open Hole Completion

  • Unable to control excessive water or gas production
  • Unable to isolate hydrocarbon zones
  • Difficult to do reservoir management
  • Has large potential to produce sand
  • Inability to produce at different zones

Nowadays, this completion is not very popular due to several limitations as stated earlier. However, some horizontal wells which have competent rock are completed with bare foot completion because the wells can produce at considerable rates compared to cemented casing completion.

References

Jonathan Bellarby, 2009. Well Completion Design, Volume 56 (Developments in Petroleum Science). 1 Edition. Elsevier Science.

Wan Renpu, 2011. Advanced Well Completion Engineering, Third Edition. 3 Edition. Gulf Professional Publishing.

Ted G. Byrom, 2014. Casing and Liners for Drilling and Completion, Second Edition: Design and Application (Gulf Drilling Guides). 2 Edition. Gulf Professional Publishing.

Determine Compressibility Factor with Present of CO2 and H2S

$
0
0

This example will demonstrate how to determine the compressibility factor (z) for gas with CO2 and H2S. As it is described in the article,Determine Compressibility of Gases , it states that gas with CO2 and H2S must be corrected. This is similar to a normal method for determining z-factor but it is required some correction. Please follow the steps below;

Gas component is shown in Table 1

Table 1 - Gas Component

Table 1 – Gas Component

Reservoir pressure = 6,000 psia

Reservoir temperature = 190 F

1)   Determine critical pressure and temperature of gas mixtures using Kay’s rule

Table 2 - Critical Pressure and Temperature

Table 2 – Critical Pressure and Temperature

Pc‘ = Σyipci = 779.7 psia

Tc’ = ΣyiTci = -22.43 F = -22.43 +460 F = 437.57 R

Table 3 - Pc' and Tr' by Kay's Rule

Table 3 – Pc’ and Tr’ by Kay’s Rule

2) Determine ɛ

E factor

Where

A =sum of mole fractions of carbon dioxide (CO2) and hydrogen sulphide (H2S) in the mixture

B = mole fraction of hydrogen sulphide (H2S) in the mixture.

A =0.082 + 0.132 = 0.214

B= 0.132

E factor 2 with number

3) Determine corrected pseudo-critical temperature (Tc”) and corrected pseudo-critical pressure (Pc”)

Corrected pseudo-critical temperature (Tc”)

TC

Corrected pseudo-critical pressure (Pc”)

corrected psedo pressure

4) Calculate pseudo reduced temperature  and pressure

Pr” = P ÷ Pc”

Pr” = 6,000 ÷ 729.94 = 8.22

Tr” = T ÷Tc”

Tr” = (190+460) ÷ (412.34)

Tr” = 1.58

Note: temperature must be in Rankin.

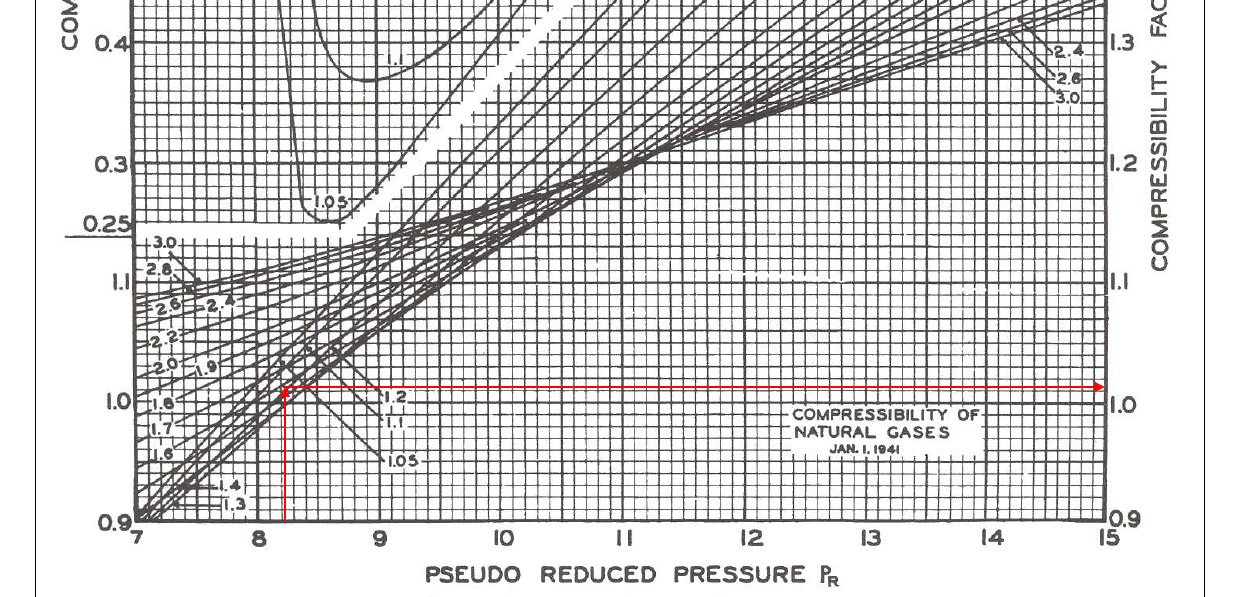
5)   Read the compressibility factor (z) from the chart.

z = 1.022

z-factor

Figure 1-z-factor from the Standing and Katz Chart

References

Abhijit Y. Dandekar, 2013. Petroleum Reservoir Rock and Fluid Properties, Second Edition. 2 Edition. CRC Press.

L.P. Dake, 1983. Fundamentals of Reservoir Engineering, Volume 8 (Developments in Petroleum Science). New impression Edition. Elsevier Science.

Tarek Ahmed PhD PE, 2011. Advanced Reservoir Management and Engineering, Second Edition. 2 Edition. Gulf Professional Publishing.

Halliburton and Baker Hughes abandon $34.6bn Takeover

$
0
0

Breaking NEWS for our industry!!

halliburton-and-baker-call-off

US oil services companies Halliburton and Baker Hughes have called off their proposed merger after resistance from regulators in the US and Europe.

The deal, announced in 2014, would have seen a $34.6bn takeover by Halliburton of Baker Hughes, creating a powerful rival to global leader Schlumberger.

Halliburton and Baker Hughes are the second and third biggest oil services companies.

That raised concerns about higher prices and reduced competition.

Baker Hughes stands to receive a $3.5bn break-up fee as a result of the deal falling through.

Failure to satisfy regulatory concerns was not the only reason for abandoning the merger.

The fall in the oil price since the proposal was announced changed the financial attractiveness of the cash and shares deal.

The US Department of Justice filed a lawsuit to stop the merger last month, arguing it would leave only two dominant suppliers in the well drilling and oil construction services industry.

The European Commission also expressed concerns that the deal might reduce competition and innovation.

Both companies have been hit by a fall in business as oil and gas giants rein back on projects and investments.

Last week, Baker Hughes reported a bigger-than-expected first-quarter loss. Last month, Halliburton announced 6,000 job cuts.

Source http://www.bbc.co.uk/news/business-36184667

Viewing all 497 articles
Browse latest View live


<script src="https://jsc.adskeeper.com/r/s/rssing.com.1596347.js" async> </script>