Quantcast
Channel: Drilling Formulas and Drilling Calculations
Viewing all 497 articles
Browse latest View live

Cement Squeeze and Cement Balanced Plug Spreadsheet Free Download

$
0
0

Cement squeeze and balanced cement plug are one of the most critical cement jobs on drilling sites. It is very critical to have the correct volume of cement and displacement in order to be successful in this operation. We create simple Excel spread sheets for both operations and these sheets are free for you to download. However, you need to carefully read the details below to understand the limitation of these two files because the calculations are based on specific criteria.

Cement-Balance-Squeeze-and-Balanced-Plug-free-download

Cement Squeeze and Balanced Plug

The calculation is based on the following criteria

  • Squeeze cement underneath the retainer
  • String the stringer out
  • Set balance cement plug on top of the retainer
  • Displacement fluid does not account for under displacement volume.
  • Line volume can be accounted into the calculation.
  • One size of cement stringer

What is the good situation to use this file?

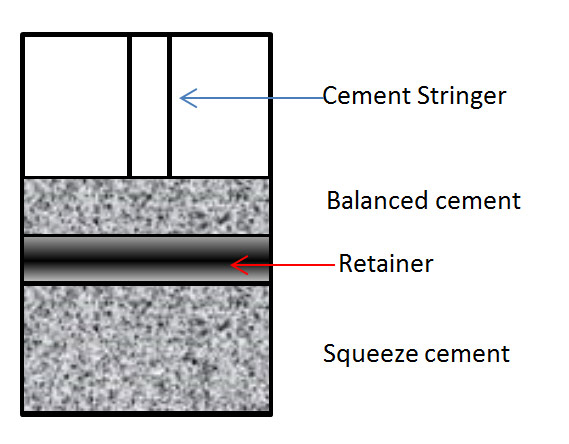
  • Plug and abandon the well by squeezing the below the casing shoe and set balance plug on top. Figure 1 demonstrates the cementing diagram.

Figure-1---Cement-Squeeze-and-Balanced-Plug-Diagram

Figure 1 – Cement Squeeze and Balanced Plug Diagram


What do you need to input?

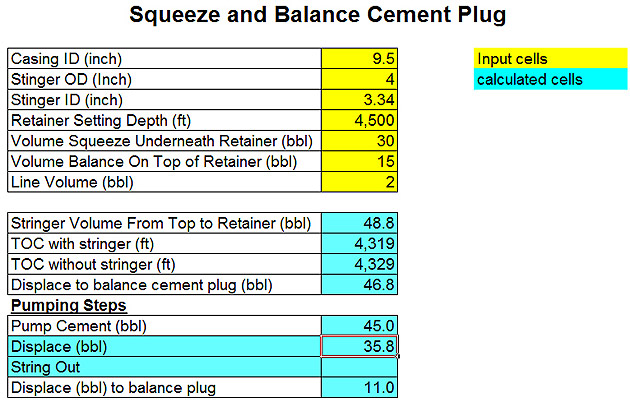
The following information must be input into the yellow shaded cells.

  • Casing ID (inch)
  • Stinger OD (Inch)
  • Stinger ID (inch)
  • Retainer Setting Depth (ft)
  • Volume Squeeze underneath Retainer (bbl)
  • Volume Balance On Top of Retainer (bbl)
  • Line Volume (bbl)

The answers will show in blue shaded cells. Figure 2 is the screen captured of this file and you may need to take time trying to play with the data.

Figure-2---Screen-capture-of-Squeeze-and-Balance-Cement-Plug-spread-sheet

Figure 2 – Screen capture of “Squeeze and Balance Cement Plug” spread sheet


Cement Balanced Plug

The calculation is based on the following criteria

  • Balanced cement plug can be set any depth
  • Cement will not drop due to density different during pumping
  • Displacement fluid does not account for under displacement volume.
  • Line volume can be accounted into the calculation.
  • One size of cement stringer

What is the good situation to use this file?

  • Set the balanced cement plug for kick off or plug and abandon
  • Set balance plug on top of retainer
  • Set balance plug in open hole

Figure 3 demonstrates the diagram of the balanced cement plug in this calculation.

Figure-3---Balance-Cement-Plug-Diagram

Figure 3 – Balance Cement Plug Diagram

What do you need to input?

The following information must be input into the yellow shaded cells.

  • Casing ID (inch)
  • Stinger OD (Inch)
  • Stinger ID (inch)
  • Cement Placement Depth (ft)
  • Balanced Cement Plug Volume (bbl)
  • Line Volume (bbl)

The answers will show in blue shaded cells.

Figure-4---Screen-capture-of-Balance-Cement-Plug-spread-sheet

Figure 4 – Screen capture of “Balanced Cement Plug” spread sheet

Download the Excel sheet for “Cement Squeeze and Balanced Plug“here – http://bit.ly/1JXHD7l

Download the Excel sheet for “Cement Balanced Plug” here – http://bit.ly/1P9HjpK

Please let us know what you think about the spreadsheet because we would like to improve its usability. We need to emphasize that these two spread sheets have certain criteria for using so please ensure that you fully understand the limitation prior. Additionally, it will be great if you can share this link to your friends / colleagues.


Working in North Sea – One of the harshest working environment in the world

$
0
0

North Sea is one of the toughest offshore conditions on the planet because extremely high wave, wind and unstable sea state. We would like to share some very interesting VDO showing conditions of rig/platform in the North Sea.

working-in-North-Sea-1
Huge waves crash against swaying North Sea oil rig


Accommodation platform Floatel Superior in Storm in the North Sea.


Borgholm Dolphin North Sea 27th Nov 2011


Dunbar Oil Rig in North Sea – Hit by huge wave (14-12-2008)


North Sea Rig in BIG storm


A Day in the Life Offshore


BBC What is life like on a North Sea rig 31.12.2013


Storm – Northsea – Offshore – Platform – F3-FB-1

Always Work Safely

Brine Density with Temperature Correction Calculation

$
0
0

Temperature has an effect on brine density so it is very critical to compensate loss of density due to temperature. Higher wellbore temperature will reduce the brine density more.  The calculation below demonstrates how to determine brine weight to mix on surface in order to get required brine density at a wellbore condition.

Brine-Density-with-Temperature-Correction

Brine weight with temperature correction equation is listed below;

Brine Density to Mix = Brine Density at Average Wellbore Temp + (Average Wellbore Temp – Surface Temp) x Weight Loss Factor

Where;

Brine Density to Mix = ppg

Brine Density at Average Wellbore Temp = ppg

Average Wellbore Temp = F

Surface Temp = F

Weight Loss Factor = ppg/F

Weight Loss Factor can be found in the table below;

Brine Weight Loss Table

Determine the weight of brine that you need to mix on surface based on the following information.

Surface temperature = 90 F

Wellbore temperature at TD = 300 F

Density of brine required for this well = 10.0 ppg

Brine Weight Loss Table 2

Solution

Average Wellbore Temp = (Surface Temperature + Wellbore Temperature) ÷ 2

Average Wellbore Temp = (90 + 300) ÷ 2= 195 F

According to the table, the weight loss factor for this case is 0.0025 ppg/F. This figure is selected because the desired weight is 10.0 ppg.

Brine Density to Mix = Brine Density at Average Wellbore Temp + (Average Wellbore Temp – Surface Temp) x Weight Loss Factor

Brine Density to Mix = 10 + (195 – 90) x 0.0025

Brine Density to Mix = 10.26 ppg

The brine density on surface must be 10.3 ppg (round up figure) to suit with this condition.

Reference books: Well Control Books

Top Drive Collision Drill Pipe and Pipe Handling System– It just happens in few seconds.

$
0
0


Top Drive colliding the rig is one of the major incidents which sometimes are happened in oil and gas industry.


topdrive-Collision-2

This VDO below shows how this accident was occurred on the rig. This is just only 51-seconds in length but it will raise your awareness about rig safe work practices.

This is the information regarding the details shown in the VDO.

What are your ideas to prevent this case to be happened again in the future?

Determine Correct Initial Circulating Pressure (ICP)

$
0
0

Correct initial circulating pressure is very important for well control operation because the correct ICP figure will tell you about the balance point while circulating the influx out using Driller’s method. Many people get confused when they try to get the right ICP because they tend to forget about a safety factor that is added while bring the pump to speed. Hence, the ICP with unintentionally added safety margin may fracture formations downhole because people will tend to add more safety factor while circulating. It means that excessive safety factor added into the system will make the well control operation worse.

determining-Correct-Initial-Circulating-Pressure

The example below will demonstrate you how to establish correct ICP

Well shut in after the influx is detected.

Stabilized shut in casing pressure = 600 psi

The float is bumped and the SIDPP is 450 psi

Figure 1 - Pressure at Shut-In Condition

Figure 1 – Pressure at Shut-In Condition


The pump is brought up to speed at 30 SPM for well kill operation by holding casing pressure constant

Casing pressure = 700 psi

Drill pipe pressure = 1,300 psi

Figure 2 - Pressure after Pump is brought to Speed.

Figure 2 – Pressure after Pump is brought to Speed.

Is 1,300 psi the correct Initial Circulating Pressure (ICP)?

The answer is NO.

If you don’t watch the pressure carefully, you will maintain the 1,300 psi as circulating pressure and you may be add safety factor over this figure. You can see that you may end up having extra safety factor which may cause formation fracture.

Look at casing pressure in Figure 2. It shows 700 psi which is 100 psi over the stabilized casing pressure (600 psi) when the well is shut in. The 100 psi represents an overbalanced therefore the circulating pressure at 1,300 psi must be subtracted with the overbalance in order to get the correct ICP

Initial Circulating Pressure (ICP) = Drill Pipe Pressure – Overbalance

Initial Circulating Pressure (ICP) = 1,300 – 100 = 1,200 psi

Figure 3 - Correct ICP

Figure 3 – Correct ICP

Always Know Overbalance

Reference books: Well Control Books

Blow Through Situation in Mud Gas Separator (Well Control Equipment)

$
0
0

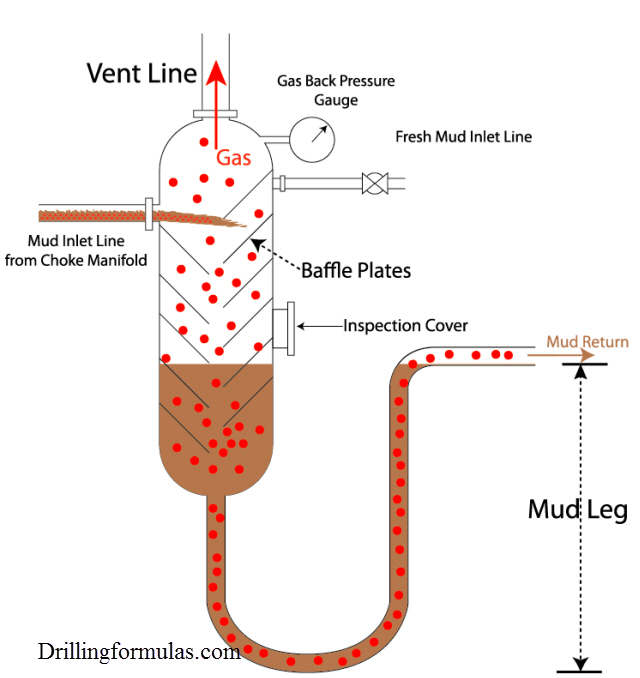
Mud leg provides hydrostatic pressure in order to prevent mud going through the separator into the rig. If the pressure in the mud gas separator exceeds hydrostatic pressure provided by mud leg, gas blowing through situation will be happened. Once blow-through occurs with a mud gas separator, it is very difficult to stop this situation until the mud leg column is re-established.

Mud-Leg-and-Blow-Through-cover

Figure 1 illustrates mud-blow through. The pressure that will create blow-through can be calculated by determining hydrostatic pressure of mud leg.

Mud Leg and Blow Through 1

Figure 1 – Blow Through Situation


The equation below demonstrate the blow-through pressure.

Hydrostatic Pressure from Mud Leg = 0.052 × Mud Weight× Mud Leg

Where;

Hydrostatic Pressure from Mud Leg in psi

Mud Weight in ppg

Mud Leg in ft

Use the following data to calculate which pressure would blow-through occur.

Mud Leg = 20 ft

Mud Density in a mud gas separator = 13.0 ppg

Vent line length = 150 ft

Mud gas separator height = 25 ft

Solution

Only mud leg and mud density will be used in the calculation.

Mud Leg and Blow Through 2

Figure 2 – Mud Gas Separator Information

Hydrostatic Pressure from Mud Leg = 0.052 × 13.0 × 20

Hydrostatic Pressure from Mud Leg = 13.5 psi

It means that if it is required 13.5 psi in this mud gas separator to overcome the hydrostatic pressure and gas blow-through will be occurred.

Reference books: Well Control Books

Blow Out on The Rig Floor VDO

$
0
0

This short VDO will show you how fast of the kick blowing out to the surface.


We don’t know detail about it why this was happened but we can learn from this incident.

blowout-on-the-rig-floor-2

  • Always monitoring the well while drilling
  • Be proactive of well control indicators
  • Frequent well control drills are recommended to perform.
  • Emergency abandon rig drills must be practices often.

What is your opinion about this case?

Please feel free to share with us.

Why is Gas Flared?

$
0
0

In petrochemical facilities and refineries flares are important for safety.  These burn the excess hydrocarbon gases in a safe manner as these can’t be recycled or recovered.  These excess hydrocarbon gases are burnt in the flare systems in a manner that is environmentally-sound.  This is an alternative to releasing this vapor directly into our atmosphere.

flare-gas-2

When flaring occurs this excess gas is combined with air and or steam and burnt off in the flare system which produces carbon dioxide and water vapor.  This process is similar to the burning of LPG or liquefied petroleum gases.  Some of us use these as fuel for home cooking.

Flair use is minimized as much as possible, but it can occur during a shut down or a start-up of any one of our facilities during the maintenance period or during unplanned operational interruptions such as a power outage.

Where does This Flaring take Place?

1) Solution Gas Flaring

When natural gas is contained in crude oil we call this solution gas.  We use flaring to dispose of natural gas along with bitumen and crude oil.  The gas is then recovered and piped to a processing facility.  When you have oil underground the reservoir pressure holds the gas in the oil.  When the oil comes to the surface, the pressure is reduced at facilities called batteries where this occurs.  This is where production from one or more wells is stored and produced.

2) Gas Plant Flaring

At Gas Processing plants water, CO2, H2S, and natural gas liquids from raw natural gas are made into natural gas that is ready for the market.  The flares are used to dispose of the gas that is unmarketable.  All plants use flares to burn off gas during upset conditions or emergencies that impact the normal day-to-day operations of the plant.  Many small plants are licensed to flare H2S rich gas once it has been removed.

3) Well Test Flaring

During the testing of all oil and gas wells, we use well test flaring.  To determine the types of fluids the well can produce, this is a standard practice.  The flow rates of fluids, the pressure and the other characteristics of the underground reservoir must also be looked at.  If pipelines are nearby, operators may be able to direct the test gas processing plant in a process called in-line testing.  For some exploratory wells this process is not practical or feasible as there may be no processing plants or pipelines nearby.

The composition, flow, and the pressure of the gas has to be determined by the processing plant or the pipelines before it can be handled safely.  The information gathered determines the economic value of the well and the type of production facilities need to be installed.  During under balanced drilling, additional flaring occurs which disposes of the gas which rises to the surface.  This reduces the damage to producing formations by the drilling fluids as well as speeds the drilling.  After certain well servicing operations, test flaring may be necessary.  On average, the flaring duration is 2.5 days

4) Natural Gas Battery and Pipeline Flaring

At field facilities like dehydrators, wells, gathering pipelines, compressors, this type of flaring can occur.  The flares burn off gas during maintenance shutdowns, emergencies, equipment failures, and other conditions.

Why do Natural Gas Facilities have Flare Stacks?

To prevent the accumulation of gases that might be a hazard, flare stacks are used as a safety measure.  At sour gas facilities were H2S is flammable slightly heavier than air, and toxic this is very important. H2S is converted into Sulphur dioxide through combustion and can be toxic, but during flaring it is lifted by the plume of gases and it’s dispersed into the atmosphere.  SO2 gases released into the atmosphere is regulated by air quality guidelines provided by the government.


Blow Out Preventer (BOP) Equipment VDO Training

$
0
0

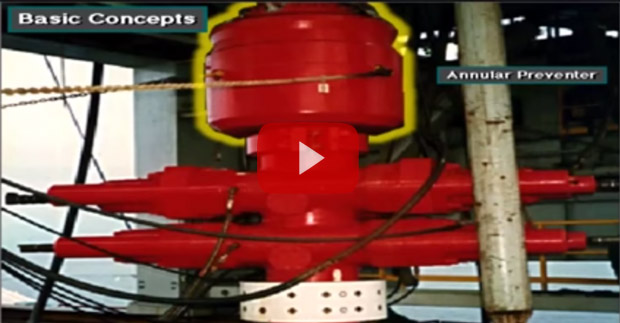
BOP equipment is one the most critical equipment for well control operation. Learning about it via VDO training is a good way to understand this subject because you can see what the equipment look like, how these equipment relates to the operation. This VDO will teach you several topics about the BOP equipment as BOP stack, choke manifold, choke panel, accumulator, etc. Additionally, the full VDO transcript is provided to aid your learning.

Full VDO Transcript

36-BOP-Equiment--Drilling-Engineer-2

The Blow Out Preventer or BOP Stack. The Driller’s BOP control panel. The BOP operating unit- accumulator. The choke manifold. The choke control panel. The mud-gas separator. The flare line and flare pit. The trip tank and drill string valves. From this BOP control panel, the driller opens and closes, or controls, the blow out preventers and the line to the choke manifold. Rig builders usually place the control panel on the rig floor, close to the driller’s positon. Levers and switches allow the driller to quickly open and close the preventers and other valves in the system. The accumulator bottles store or accumulate hydraulic fluid under very high pressure up to 3,000 psi(over 20,000 kilo pascal). This high pressure fluid ensures that the preventers close very fast. The BOP operating unit accumulator is installed some distance from the rig floor. When the driller activates the BOP operating unit, it pumps the hydraulic fluid through the high pressure pipes, or lines, into the BOP stack. The hydraulic pressure opens or closes the preventers. Usually, the driller operates the accumulator from the control panel on the rig floor. In an emergency however, crew members can operate the BOPs by using the control valves on the accumulator itself.
Here’s a choke manifold. Flow gets to it from the BOP stack via a choke line. The manifold usually has two special valves in it called the chokes. Usually well flow goes through only one of the chokes.
The others are backups or used under special conditions. By adjusting the size of the opening of the choke, making the opening smaller or larger, the driller adjusts the amount of flow through the choke. The smaller the opening, the less flow. The larger the opening, the more flow. The less flow, the more bank pressure on the well. The more flow, the less bank pressure on the well. This adjustment of bank pressure keeps the pressure on the bottom of the flow constant, so that no more kick fluids can enter the well. The driller or another crew member uses the choke control panel to adjust the size of the choke’s opening as kick fluids flow through it. By watching the pressure on the drill pipe encasing, and by keeping the mudbomb at a constant speed, the choke operator can adjust the choke to keep the pressure on the bottom of the hole constant.
The choke operator must keep the bottom hole pressure constant to successfully control and circulate a kick out of the hole. Often, kick fluids and mud from the choke manifold go through a line to a mud-gas separator. Frequently, formation gas is the main part of a kick. However, kick fluids may also contain water, oil, or a combination of these fluids. In any case, the mud-gas separator removes the gas from the mud. With the gas removed, the pump circulates gas-free mud into the mud tanks, and back down the hole. The separated gas goes to a flare line.
In the separator, mud, with gas in it from the choke manifold, enters the top and falls over several baffle plates. The gas breaks out of the mud as it falls over the baffle plates and goes into the flare line. The gas-free mud flows into the bottom outlet, where it goes to the mud tanks for circulation down hole. The flare line conducts gas from the mud-gas separator to the flare pit on land rigs. The gas is burned, or flared, at the flare pit. Notice that the flare line outlet is a good distance away from the rig floor; so even while gas is flaring, the crew can safely work on the rig floor.
Offshore, where there is no flare pit, the flare line conducts the gas over the side of the rig. The line runs over the water a safe distance away from the rig. A trip tank is a special mud tank. It is used when they pull drill string from the hole; for example, to change out a dull bit. They also use a trip tank when they run drill string back into the hole. Pulling the drill string and running it back in is called a trip, which is why they call this small tank a trip tank. They use it to keep accurate track of how much mud the drill string displaces in the hole. When the crew pulls drill string from the hole, the mud level in the hole drops. If they let the mud level drop too far, it won’t exert enough pressure to keep formation fluids from entering the hole.
So, as the crew pulls pipe, they continually circulate fluid from the trip tank to replace the drill string and keep the hole full. They also watch for unusual changes, and they make sure that the volume of mud they put in exactly replaces the volume occupied by the drill string. Since the volumes are small, the level of mud in the trip tank is calculated in small increments, such as stands of pipe or barrels, or liters of mud, or both. If the volume they put at is less than the volume occupied by the drill string they removed, then it’s likely that formation fluids have entered the hole. For example, let’s say the crew pulls one stand of drill pipe. In this instance, the stand displaces .7 barrels or 111 liters. Therefore, they should pump .7 barrels, or 111 liters, of mud to replace the stand. The mud level in the trip tank should show a drop of .7 barrels or 111 liters. If the level in the tank shows less, then formation fluids have entered the hole, and the crew must take steps to control the well.

Design Factors Relating To Properly Design The Right Size of Mud Gas Separator for Drilling Rig

$
0
0

A mud gas separator or poor boy degasser or gas buster is one of the most critical well control equipment on drilling rigs. It is used to separate gas kick from drilling mud while circulating kick out of wells or circulating gas while drilling or workover operations. The mud gas separator used on drilling rigs is typically a vertical cylindrical vessel with many baffle plates inside because vertical vessels have small footprints. The drilling mud from the well goes into the mud gas separator and hits baffles. Then gas will be removed due to hitting action. The gas will go up and exist to atmosphere via a vent line at the top of the vessel. The drilling fluid drops after colliding baffles and exists the mud gas separator through the line and return to a mud pit.

Many-factors-are-involved-to-properly-size-mud-gas-separator

Normally, hydrostatic pressure provided by mud leg or mud seal is the maximum allowable pressure in the MSG. Operating over the mud leg pressure will result in a blow-through situation which is the situation when gas from the drilling mud going through mud leg and returning back to the rig. This maximum operating pressure depends of fluid density in the MSG but normally the pressure is below 15 psis (1 bar). The friction pressure of gas flowing through the vent line must be less than pressure from the mud leg.

There are several factors that you need to consider when designing a proper size MGS for a drilling rig.

Kick volume – For the design purpose, gas volume is used for determining the size of MSG. Proper assumption of allowable gas kick volume is needed.

Mud leg height – The minimum mud leg height is determined by the vent line friction pressure and drilling mud density expected to see during well kill operation. Typically, oil density is used to determine the mud leg height because it is a worst-case scenario.

Vent line friction – size and shape of vent line affects the friction. There are several methods to determine friction of gas flowing through vent line.

Kill rate – The kill rate is required to determine gas flow rate through the MGS and it relates to the gas flow rate through MSG. More kill rate = more gas flow rate.

For full detailed calculation, you can find out from this SPE No. 20430 – Mud Gas Separator Sizing MacDougall.

What will be occurred if improper size of MGS is used?

  • Unable to handle gas at a planned kill weight and gas will go back to the rigs.
  • In order to control excessive gas because you cannot handle with MGS, the well must be choked back and it will result in high back pressure. With additional back pressure, the formation or casing shoe can be broken.
  • The vessel and vent line can be damaged due to excessive flow.


Introduction to Oil and Gas Industry E-book Free Download – Oil – An Introduction for New Zealanders

$
0
0

Do you ever want to explain to your friends and family members to understand about oil and gas industry?

You know that it is quite difficult to explain someone who never been working and involving in this industry to fully understand the big picture. You need to share this book to them.

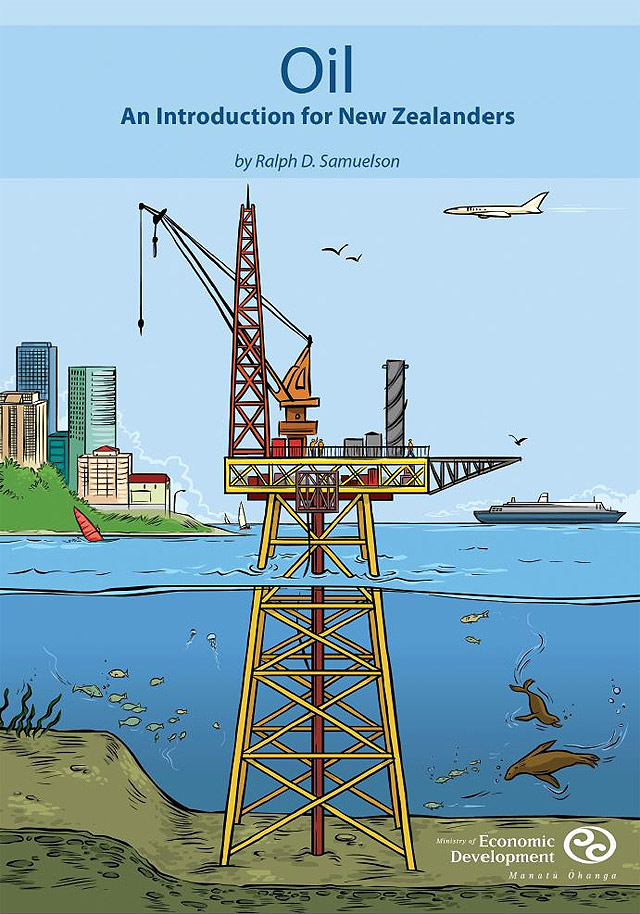
Oil: An Introduction for New Zealanders by Ralph D. Samuelson

1-oil-An-Introduction-for-New-Zealanders


Published by the New Zealand Ministry of Economic Development

Download – http://www.med.govt.nz/sectors-industries/energy/pdf-docs-library/energy-data-and-modelling/publications/oil-an-introduction.pdf/at_download/file

This book was written by Ralph D. Samuelson to promote the right information to New Zealand people. Not only is this book good for new Zealanders but also it is very useful for anybody. It is an excellent book because it covers a lot of aspects of oil industry with a non-technical language therefore everybody can understand the contents from the book easily.

These are the topics that are presented in this book.

Introduction

1 The Fundamentals of Oil

1.1 The Chemistry of Oil

1.2 Oil Products

1.3 The Geology of Oil

1.4 Oil Production

1.5 Oil Refineries

2 World Oil Resources

2.1 Reserve Estimates

2.2 Resource Estimates

2.3 Concentration of Oil in a Few Countries

2.4 Unconventional Oil

2.4.1 Tar Sands and Bitumen

2.4.2 Extra-Heavy Crude

2.4.3 Oil Shales

2.5 Alternatives to Oil

2.5.1 Fossil Fuel Alternatives

2.5.2 Biofuels

2.5.3 Electricity and Hydrogen

2.6 Summing Up – The Uncertain Future of Oil

3 Exhaustible Resource Economics

3.1 Decision Making for a Renewable Commodity

3.2 Decision-Making for an Exhaustible Resource

3.3 The Impact of Extraction Costs

3.4 The Impact of Higher Extraction Costs

3.5 The Impact of Rising Oil Prices

3.6 The Impact of Lower Interest Rates

3.7 The Impact of Technological Improvement

3.8 The Real World

4 Oil and Financial Markets

4.1 Oil Trading

4.2 Market Efficiency and Financial Markets

4.3 Oil Futures Markets as Predictors of Spot Oil Prices

4.4 Oil Futures Markets and “Normal Backwardation”

5 New Zealand’s Oil Industry

5.1 New Zealand’s Crown Estate

5.2 New Zealand’s Undersea Jurisdictions

5.3 New Zealand’s Oil Resources

5.4 The New Zealand Oil Product Market

5.5 Investigations of Market Competitiveness

6 Oil: The Consumer Side

6.1 Elasticity of Demand

6.2 Fuel Taxation

6.3 Price Monitoring and Reporting

6.4 Product Quality Regulation

7 Oil Security and the International Energy Agency

7.1 The International Energy Agency

7.2 The IEA and Oil Security

7.3 New Zealand’s Oil Security

Appendix A – Example Tables Illustrating Exhaustible Resource

Decision Making

A.1 Impact of Extraction Costs

A.2 Impact of Higher Extraction Costs

A.3 Impact of Increasing Oil Price

A.4 Impact of Interest Rates

Appendix B – Glossary

 Additionally, the illustrations in this book are well presented so they are very helpful for learners to get the content correctly and easily.

2-oil-An-Introduction-for-New-Zealanders

3-oil-An-Introduction-for-New-Zealanders

Well Construction Objectives for Exploration Wells, Appraisal Wells and Development Wells

$
0
0

Well planning, design and construction phases are mainly concerned with three objectives:

  1. Well objectives as producing or exploring.
  2. Environmental and Safety Objectives
  3. Total expenditure and budget of the project

The above mentioned objectives do not come with standard specific goals and vary based on the location and environment of operations. The planning team has to correctly identify all the goals and factors that influence the project.

Well-Objectives-and-Success-Factors-For-Well-Planning

The first step of well planning is Well Proposal or Statement of Requirements and it is mainly concerned with the Exploration and Reservoir Engineering Department. The contents of this document include the specific objectives of the well and are can be classified as Exploration, Appraisal or Development.

Exploration Wells

The main motive behind the design of exploration wells is to assess if a subsurface prospect comprises of commercial amounts of hydrocarbons. Each exploration program can comprise of any number of wells.

Exploration wells are mainly used for data collection from potential reservoirs by making use of formation evaluation methods which might be coring, logging and well testing.

When exploration wells are drilled, they are unsure about the presence of commercial oil or gas. Also, the wells are drilled on a temporary basis and are not intended for long term use. Also, if in case oil is discovered in the exploration well, an appraisal process has to be carried out and all the alternatives must be considered, which includes the selection of development plan, implementation of the plan along with the construction of wells, infrastructure and other facilities. Usually, wells drilled offshore or the floating rigs are abandoned once the work is done. Hence, it is essential that all the objectives are achieved at a minimal cost without any compromise in the functionality and objectives.

Appraisal Wells

The design, planning process and construction of appraisal wells are identical to exploration wells. However, appraisal wells are drilled only when a discovery is made, with the motive of assessing the size and viabilities of the reservoirs. They can also be drilled to obtain more information about the geology or geometry of a well present. Once the sought after information about an appraisal well is met, the drilling can be called successful.

Development Wells

The broad classification of wells that are drilled with the purpose of production, injection or observation of appraisal wells are known as development wells. The life cycle and operational period of development wells are much greater than appraisal wells. Development wells are drilled with various different objectives, such as flowing production, artificial lift production, injection of water or gas and to monitor the performance of a well. Over the course of time, these wells would see several work-overs, upgrades and simulations. To start with, the most basic requirement of a development well should be that the bore diameter of the well should be large enough to contain all the equipment that might be used and should reach the expected production rate without high costs or upgrades involved.

Determine Stuck Pipe Depth Based on Real Example

$
0
0

This is the real example of how to determine stuck depth using the stuck depth calculation.

Well Information:

  • TD = 8,900’MD/5,600’ TVD
  • Bit Size = 8.5”
  • Drilling fluid = water based mud (PHPA system)
  • Formation: sand shale sequence
  • BHA: 7” mud motor + 9 stands of 5” HWDP S-135, 4-1/2” IF connection
  • Drillstring: 5” DP S135, 4-1/2” IF connection
  • Neutral weight @ 6,850’MD = 175 Klb

While tripping out of hole to 6,850’MD, observe over pull 40 Klb over pick up weight. Stop tripping out and attempt to go down no issue. Attempt to rotate, pipe is able to rotate at 30K ft-lb. Attempt to circulate, observe restricted flow.

Figure 1 - Stuck While Pulling Out

Figure 1 – Stuck While Pulling Out

Based on the information, we would expect the cutting load bed issue. We attempt to determine where the stuck point is using the stuck depth formula.

Stuck Depth (ft) = (735,294 x e x Drill Pipe Weight (ppf)) ÷ (Differential Pull, lb)

Where;

e = drill pipe stretch, inch

Pipe Stretch Information

Pull the stuck string to 300 Klb and the stretch measurement is 29.4 inch from the neutral point.

Pull the stuck string to 350 Klb and the stretch measurement is 49.2 inch from the neutral point.

So

Differential pull = 350,000 – 300,000 = 30,000 lb

e = 49.2 – 29.4 = 19.8 inch

Drill Pipe Weight (ppf) = 23.52 ppf adjusted weight

Note: The adjusted weight is used instead of the plain weight because it represents the whole string better than the plain weight.  The plain pipe weight can be used for tubular as casing or tubing which don’t have tool joints.

Figure 2 - 5DP S-135 Specification

Figure 2 – 5″DP S-135 Specification


Stuck Depth (ft) = (735,294 x 19.8 x 23.52) ÷ (50,000)

Stuck Depth (ft) = 6,784 ft

Based on this calculation, the drill string is stuck at the BHA.

Figure 3 - Stuck Location (Stuck at BHA)

Figure 3 – Stuck Location (Stuck at BHA)

Reference book: Drilling Formula BookFormulas and Calculations for Drilling, Production and Workover, Second Edition

Using Combined Load Chart For Stuck Pipe Situation

$
0
0

When the drill string get stuck, there are several ways to free the string as using Jar (up and/or down), straight pull, working torque down, etc. Pulling stuck pipe with torque in the drill string is one of those technique which often utilize to free the stuck drill string. However, there are some concerns that you should know before doing this because torque in the string will reduce a tensile capacity of tubular. This is very important to read and understand the combined load chart (Torque‐Tension Graph) in order to determine the limitation before pulling the pipe.

combined-load-chart-for-stuck-pipe

For this example, we use 5” DP, S-135, NC50 (4-1/2” IF connection) to be a reference figure.

Pipe information

  • Pipe Size and Weight: 5.000″ 19.50ppf 0.362″ wall IEU
  • Pipe Grade: S-135
  • Range: 2
  • Tool Joint: 6.625″ X 3.250″ NC50
  • Tool Joint 120,000 psi Material Yield Strength
  • Premium class

pipe spec

You can find the specification sheet from this http://www.workstringsinternational.com/pdf/specs/drill_pipe/us/5.000in%200.362wall%20IEU%20S135%20NC50%20(6.625%20x%203.250%20TJ)%209P%2012B.pdf

Reference source –  http://www.workstringsinternational.com

This is the combined load chart (Torque‐Tension Graph).

Figure 1 - Combined Load Chart for 5DP, S135, NC50 (4-12 IF)

Figure 1 – Combined Load Chart for 5″DP, S135, NC50 (4-1/2 “IF)


No Torque in Drill String

Without torque, the pipe body tensile strength = 560,800 lb (Point A) and tool joint tensile strength = 1,25 million lbs (Point D). At this point, the weakest point is obviously pipe body.  Point B and Point C represents tool joint tensile strength at minimum and maximum recommended make up torque, respectively.

Max Recommended Make-up Torque (ft-lbs) = 30,700 ft-lb

Min Recommended Make-up Torque (ft-lbs) = 25,600 ft-lb

A tool joint with make-up torque between min and max recommended make up torque will have tensile strength approximately of 1.1 million lbs.

Figure 2

Figure 2 – Combined Load Chart at Zero Torque


20,000 ft-lb Torque in Drillstring

Referring to Figure 3, the tensile capacity of pipe body is reduced to approximately 550,000 lb (Point A) but the tool joint tensile capacity is still the same value of approximately of 1.1 million lbs with make up torque between min and recommended make up torque (Point B and Point C).

Figure 3

Figure 3 – Combined Load Chart at 20,000 ft-lb Torque


30,000 ft-lb Torque in Drillstring

Referring to Figure 4, the tensile capacity of pipe body is reduced to approximately 500,000 lb (Point A) but the tool joint tensile capacity is still the same value of approximately of 1.1 million lbs with make up torque close to the recommended make up torque (Point C).

Figure 4

Figure 4 – Combined Load Chart at 30,000 ft-lb Torque

Conclusion

Torque in the drillstring reduces the tensile capacity of pipe body therefore it is very important to check the pipe limitation by analyzing the torque-tension chart before applying a combined load in the drillstring. Utilizing the combined load chart will tell you the limit and reduce risk of parting the string unintentionally.

World’s Tallest Offshore Facilities as of 2015

$
0
0

When people talk about the tallest man-made structure, most people think about buildings as Burj Khalifa, Tokyo Sky Tree, CN Tower etc. However, offshore structures are far even taller than the tallest building.

word-tallest-offshore-facilities

You will be amazed if you see the info graphic below.

Print

Credit: http://theogm.com

Perdio Regional Host = 2,438 m (7,999 ft)

Ursa Platform Tower = 1,306 m ( 4,285 ft)

The Petronius Compliant Tower = 640 m ( 2,100 ft)

Baldplate Compliant = 579.7 m ( 1,902 ft)

Bullwinkle Platform = 529.1 m ( 1,736 ft)

Troll A Platform = 472 m( ft)


Oil Rig Tile Puzzle Jigsaw Android App Game

$
0
0

Oil Rig Tile Puzzle is a puzzle Android app which has various images of oil drilling rig both onshore and offshore. You can enjoy playing this app and be able to see spectacular photos of oil rig. This application is fit for all player age and it is very good for oilfield people and their families.

oil-rig-tile-puzzle-app


Link – https://play.google.com/store/apps/details?id=com.funappdev.oilrigtilepuzzle

Feature of this application:

This tile puzzle game has three levels as follows;

– Easy = it is 3 x 3 puzzle.

– Medium = it is 4 x 4 puzzle.

– Hard = it is 5 x 5 puzzle.

Tile-Puzzle-Icon-512

How To Play

–  Tab and move the puzzle part to the right location.

– You need to complete each level before the time is up.

– You will able to play the next level one the current level is completed.

– You can come back and play the same level again once you win these levels.

These are some pictures from this app.

_0000_iStock_000021995588_XXXLarge

_0001_iStock_000007026629_Full

_0002_iStock_000017974177_Large

Bullheading Calculation Example

$
0
0

Bullheading is one of the well control methods that involve pumping formation fluids back into formation into a shut-in well. You can read the basic details about bullheading from this link  http://www.drillingformulas.com/bullheading-well-control-method/. For this time, this article will be focused on a calculation example for bullheading operation.

Bull-Heading-Calculation

Components of Pumping Pressure

For the bullheading operation, pumping pressure on surface is equal to summation of all frictional pressure and formation pressure minus hydrostatic pressure (Figure 1). The equation below shows this relationship in a mathematical term.

Pump Pressure = Friction Pressure of Surface Lines + Friction Pressure of Tubing + Friction Pressure Across Perforations + Formation Pressure – Hydrostatic Pressure of Tubing

The pump pressure concept will be utilized for the bull heading calculation.

 47 Bullheading Calculation-1-01

Figure 1 – Pump Pressure Components

The well information is give below;

Production casing was set at 12,000’MD/12,000’TVD.

Bottom of perforation is at 11,500’MD/11,500’TVD.

Bottom of perforation is at 11,000’MD/11,000’TVD.

End of production tubing is at 11,500’MD/11,500’TVD.

Production packer is at 10,300’MD/10,300’TVD.

Formation fracture gradient is 0.645 psi/ft

Formation pressure gradient is 0.445 psi/ft

Shut in tubing pressure = 2,800 psi

Production casing: 7” OD, 29 ppf, L-80, capacity factor = 0.0371 bbl/ft

Production tubing: 3.5” OD, 9.2ppf, L-80, capacity factor = 0.0087 bbl/ft

Pump output (bbl/stk) = 0.1 bbl/stk

Figure 2 describes the wellbore diagram based on the given information.

47 Bullheading Calculation-1-02

Figure 2 – Diagram of the well

Calculations

For the bull heading calculation, reference points for calculation formation pressure, fracture pressure, kill weight mud are based on top of perforation because it gives the most conservative fracture pressure value.

Formation Pressure (psi) = Pressure Gradient (psi/ft) x Top of Perforation TVD (ft)

Formation Pressure (psi) = 0.445 x 11,000 = 4,895 psi

Fracture Pressure (psi) = Fracture Gradient (psi/ft) x Top of Perforation TVD (ft)

Fracture Pressure (psi) = 0.645 x 11,000 = 7,095 psi

Initial Hydrostatic Pressure (psi) = Formation Pressure (psi) – Shut In Tubing Head Pressure (psi)

Initial Hydrostatic Pressure (psi) = 4,895 – 2,800 = 2,095 psi

Initial Average Fluid Density (ppg) = Initial Hydrostatic Pressure (psi) ÷ (0.052 x Top of Perforation TVD (ft))

Initial Average Fluid Density (ppg) = 2,095 ÷ (0.052 x 11,000) = 3.66 ppg

Kill Weight Mud (ppg) = Initial Average Fluid Density + (Shut In Tubing Pressure (psi) ÷ 0.052 ÷ Top of Perforation TVD (ft))

Kill Weight Mud (ppg) = 3.66 + (2800÷ 0.052 ÷11,000) = 8.6 ppg

Maximum Initial Surface Pressure (psi) = Formation Fracture Pressure (psi) –Initial Hydrostatic Pressure (psi)

Maximum Initial Surface Pressure (psi) = 7,095 – 2,095 = 5,000 psi

The below calculation relates to pressure while bullheading.

Maximum End of Tubing Pressure (psi) = Fracture Pressure (psi) – (Kill Weight Mud (ppg) x 0.052 x End of Tubing TVD (ft)) – Initial Average Fluid Density (ppg) x 0.052 x (Top of Perforation TVD (ft) – End of Tubing TVD (ft))

Maximum End of Tubing Pressure (psi) = 7,095 – (8.6 x 0.052 x 10,500) – (3.66 x 0.052 x (11,000 – 10,500)) = 2,304 psi

Maximum pressure when Kill Mud Weight reaches perforation

@ Top of Perforation (11,000 ft TVD)

Maximum Final Pressure (psi) = Formation Fracture Pressure @ top of perforation (psi) – (Kill Weight Mud (ppg) x 0.052 x Top of Perforation TVD (ft))

Maximum Final Pressure (psi) = 0.645 x 11,000 – (8.6 x 0.052 x 11,000)

Maximum Final Pressure (psi) = 2,176 psi


@ Bottom of Perforation (11,500 ft TVD)

Maximum Final Pressure (psi) = Formation Fracture Pressure @ bottom of perforation (psi) – (Kill Weight Mud (ppg) x 0.052 x Bottom of Perforation TVD (ft))

Maximum Final Pressure (psi) = 0.645 x 11,500 – (8.6 x 0.052 x 11,500)

Maximum Final Pressure (psi) = 2,275 psi

The most conservative figure for the maximum final pressure is 2,176 psi.

As you can see, the figure reference to the top of perforation gives the most conservative figure. This is the reason why top of perforation is selected for the calculation.

Volume Pumped in Tubing (bbl) = Tubing Capacity Factor (bbl/ft) x Length of Tubing (ft)

Volume Pumped in Tubing (bbl) = 0.0087 x 10,500 = 91.4 bbl

Stroke Pumped in Tubing (stk) = Volume Pumped in Tubing (bbl) ÷ Pump Output (bbl/strk)

Volume Pumped in Tubing (stk) = 91.4 ÷ 0.1 = 914 strokes

Volume Pumped From End of Tubing to Top of Perforation (bbl) = Casing Capacity Factor (bbl/ft) x (Top of Perforation TVD (ft) –End of Tubing TVD (ft))

Volume Pumped in Tubing (bbl) = 0.0317 x (11,000 – 10,500) = 18.6 bbl

Stroke Pumped From End of Tubing to Top of Perforation (stk) = Volume Pumped in Casing (bbl) ÷ Pump Output (bbl/strk)

Volume Pumped in Tubing (stk) = 18.6 ÷ 0.1 = 186 strokes

Volume Pumped From Top of Perforation to End of Perforation (bbl) = Casing Capacity Factor (bbl/ft) x (End of Perforation TVD (ft) – Top of Perforation TVD (ft))

Volume Pumped in Tubing (bbl) = 0.0317 x (11,500 – 11,000) = 18.6 bbl

Stroke Pumped From Top of Perforation to End of Perforation (bbl)) = Volume Pumped in Casing (bbl) ÷ Pump Output (bbl/strk)

Volume Pumped in Tubing (stk) = 18.6 ÷ 0.1 = 186 strokes

Total Volume Pumped Summary

Table for volume summay

In order to push all formation fluid back to formation, it is required that the pumping volume must be at least volume from surface to end of perforation.

Pressure Schedule While Bull Heading

This is the same concept as pressure schedule in wait and weight well control method.

Pressure Decreasing in Tubing (psi/required stks) = (Maximum Initial Surface Pressure (psi) – Maximum End of Tubing Pressure (psi)) X Required strokes (stks) ÷ Tubing volume (stk)

For this calculation, 100-strokes is selected.

Pressure Decreasing in Tubing (psi/required stks) = (5,000 – 2,304) x 100 ÷ 914 = 295 psi / 100 stks

Pressure Decreasing in Casing (psi/required stks) = (Maximum Initial End of Tubing Pressure (psi) – Maximum Final Pressure (psi)) X Required strokes (stks) ÷  Volume from End of Tubing to Top of Perforation (stk)

Pressure Decreasing in Casing (psi/required stks) = (2,304 – 2,176) X 100 ÷ 186 = 96psi / 100 stks

Draw the bullhead chart based on this data

The red line is the maximum pressure. If pressure exceeds the red line, a formation will be broken down (fracture zone). The blue line represents a shut in condition. Pressure below the blue line means that the well is in an underbalanced condition (flow zone). The area between the red line and blue line is the safe zone for bullheading operation (Figure 3).

47-Bullheading-Calculation-1-03

Figure 3 – Bullheading Chart

For safe operation, pumping pressure must be within the bullheading zone (Figure 4).

47-Bullheading-Calculation-1-04

Figure 4 – Safe Bullheading


The formations may be fractured if pumping pressure exceeds the fracture line (Figure 5).

47-Bullheading-Calculation-1-05

Figure 5 -Bullheading Operation Exceeding Fracture Pressure

 Note: this chart is constructed without accounting for friction pressure. It is the most conservative pressure to prevent fracturing formation.

Reference books: Well Control Books

Blowout Preventers (BOP) VDO Training

$
0
0

All drilling rigs have the Blow Out Preventer because it is a mandatory equipment for well control, therefore personnel who has work relating to drilling operation must learn about the BOP. Learning via VDO training gives you several advantages as clear descriptions with relating images, etc so learners can learn faster and get correct massage.

This VDO below teaches about the BOP and we also provide the full VDO transcript as usual to accelerate learning capability.

Full VDO Transcript

37-Blowout-Preventers-(BOP)--Drilling-Engineer-2
The Blowout Preventer, BOP Stack, consists of several large valves stacked on top of each other. These large valves are called blowout preventers. Manufacturers rate BOP Stacks to work against pressure as low as 2,000 per square inch or psi, and as high as 15,000 psi. That’s about 14,000 kilo pascals to over 100,000 kilo pascals. Rigs usually have two kinds of preventers. On top is an annular preventer. It’s called an annular preventer because it surrounds the top of the wellbore in the shape of a ring or an annulus. Below the annular preventer are ram preventers.

 
The shut-off valves in ram preventers close by forcing or ramming themselves together. The choke line is a line through which well fluids flow to the choke manifold when the preventers are closed. Even though the preventers shut in the well, the crew must have a way to remove or circulate the kick in the mud out of the well. When the BOP shut in the well, mud and formation fluids exit through the choke line to the choke manifold. The manifold is made up of special piping and valves. The most important valve is the choke. The choke is a valve that has an adjustable opening. Crew members circulate the kick through the choke to keep back pressure on the well.

 
Keeping the right amount of back pressure prevents more kick fluids from entering the well. At the same time, they can get the kick out of the well and put in heavier mud to kill the well, that is, regain control of it. The well fluids leave the choke manifold and usually go to a mud-gas separator. A mud-gas separator separates the mud from the gas in the kick. The clean mud goes back to the tanks; the gas is flared or burned a safe distance away. When the well takes a kick and the BOPs are opened, well fluids force mud to flow up the wellbore and into the BOP stack. When the driller closes the annular BOP, flow stops. Usually, drillers close the annular BOP first. The closed annular BOP diverse the flow of the choke line, which goes to the choke manifold. The driller can open a valve from the choke line and safely circulate the kick out of the well through the choke manifold.

Well Flowing After Disconnecting The Wireline Lubricator – Well Control Situation

$
0
0

Please watch the footage below. It was a flow back after breaking out the lubricator on the rig floor.

We don’t know full details what was happened but from what we’ve seen in this VDO, it shown that the well was flowing after the wireline operation was completed. The crew broke out the connection between the wireline lubricator and the string set on the rotary table.  Few seconds after the connection was removed, the well flowed back. The flow became stronger as you can see the drilling fluid was pushed out from the drillstring quickly and the rotary table started to turn black. The lubricator was pushed by hydraulic power from the mud and it was swung around. Eventually, the crew went back to connect the lubricator to the string and the well stopped flowing.  It seem like the situation was under control at the end. Luckily, there was no gas or any spark that can cause fire on the rig floor.

What Could be Done Better?

flow-back-2

These are some key learning points that we can learn from this VDO.

  • A Full Opening Safety Valve (FOSV) should be installed on top of the string. If the well is flowing, the crew shut the well in by closing the FOSV. The risks to the crew will be greatly reduced.
  • Under estimation of formation pressure and wellbore hydrostatic pressure. Pore pressure greater than hydrostatic pressure will create an underbalanced condition.
  • Contingency well control plan should be in place prior to performing the operation. This VDO shown that there was no plan to handle the unexpected well control situation. Typically, if this case is happened, the crew should be ready to stab the FOSV so as to shut the well in.
  • Ensure the connection of FOSV is the same connection as the tubular otherwise a cross over must be prepared.

What Are Your Thought about This Case?

We would like to hear from your experience so please feel free to share your thought with us.


Hole Monitoring Procedures While Drilling or Milling Operation

$
0
0

This is the example of hole monitoring procedure while drilling or milling and this will give you some ideas only. You need to adjust it to suit with your operation

Hole-Monitoring-Procedures-While-Drilling-or-Milling-Operation

  • Perform pre-job safety meeting with personnel involved in operation.
  • The Driller or the toolpusher on the break is responsible for monitoring a well condition and identifying when a well must be shut-in with safe and correct practices.
  • If the driller sees a hole problem, the drilling operation must be stopped and inform the following people: Toolpusher, Senior Toolpusher and Company Representative.
  • Shut In Procedure While Drilling or Milling for Well Control Situation must be posted in the driller cabin where the driller can see it easily at all time.
    • Note: shut in procedure depends on requirement on each company.

  • The Driller has a responsibility to check all well control equipment and record into the sheet at the beginning of tour.
  • The Driller must review the schematic for line up and ensure the correct line up for required operation.
  • A drilling parameter trend sheet will be updated every hour during drilling operations. The parameters are as follows; RPM, active pit volume, % return flow, Rate Of Penetration (ROP), drilling torque, off bottom torque, pickup weight / slack-off weight, mud density, gas units or percentages, pumping pressure, Equivalent Circulating Density (ECD), etc.
  • The driller must monitor any drilling break and inform Toolpusher and Customer Representative if there is drilling break.
  • Kick detection devices as flow show, Pit Volume Totalizer monitor, and alarm must be tested properly and regularly.
  • Mud logger kick detection devices must also tested in the same way as rig instrumentation to confirm an accuracy and readiness.
  • Set the PVT gain/loss and the flow show at required level.
  • Discuss with pump man, shaker man, centrifuge engineer and mud engineer to have a proper communication prior to transferring any drilling fluid. Driller and mud logger must be informed prior to making any changes in the mud pit level. Any changes in centrifuge parameters must be also informed a driller and a mud logger.
  • A full opening safety valve and a closing handle with correction bottom connections that fit with of drill string which is being used must be available on the drill floor at all time. It must leave in an opened position. Driller must check this equipment.
  • The driller must confirm a current space out diagram and ensure the correct height.
  • Monitor drilling mud properties and ensure that personnel involving in drilling fluid as mud engineer, pump man, shaker man and centrifuge engineer to communicate to the drilling if there is any changes in mud properties, especially mud weight.
  • Discuss with shaker man to closely monitor cuttings over the shale shakers. If excessive cuttings and/or change in casing size/shape are observed, inform the Driller, Toolpusher and Customer Representative. It is a possible well control indicator.
  • If one of the positive well control indicators is seen, the driller must shut the well in as per a shut in procedure. Then inform Toolpusher, senior Toolpusher and Customer Representative.
  • If one of the possible well control indicators is seen, the driller must stop drilling and flow check the well. Then inform Toolpusher, senior Toolpusher and Customer Representative.
  • If there is any doubt in the well condition, the driller has the right to shut the well in. Then inform Toolpusher, senior Toolpusher and Customer Representative. Do not try to contact any supervisors first.


Viewing all 497 articles
Browse latest View live


<script src="https://jsc.adskeeper.com/r/s/rssing.com.1596347.js" async> </script>